Email Analytics for Teams: The Complete Guide (2026)
Email analytics measures how your team handles email, response times, workload, SLA compliance. Not the same as email marketing analytics. The complete guide for team managers.

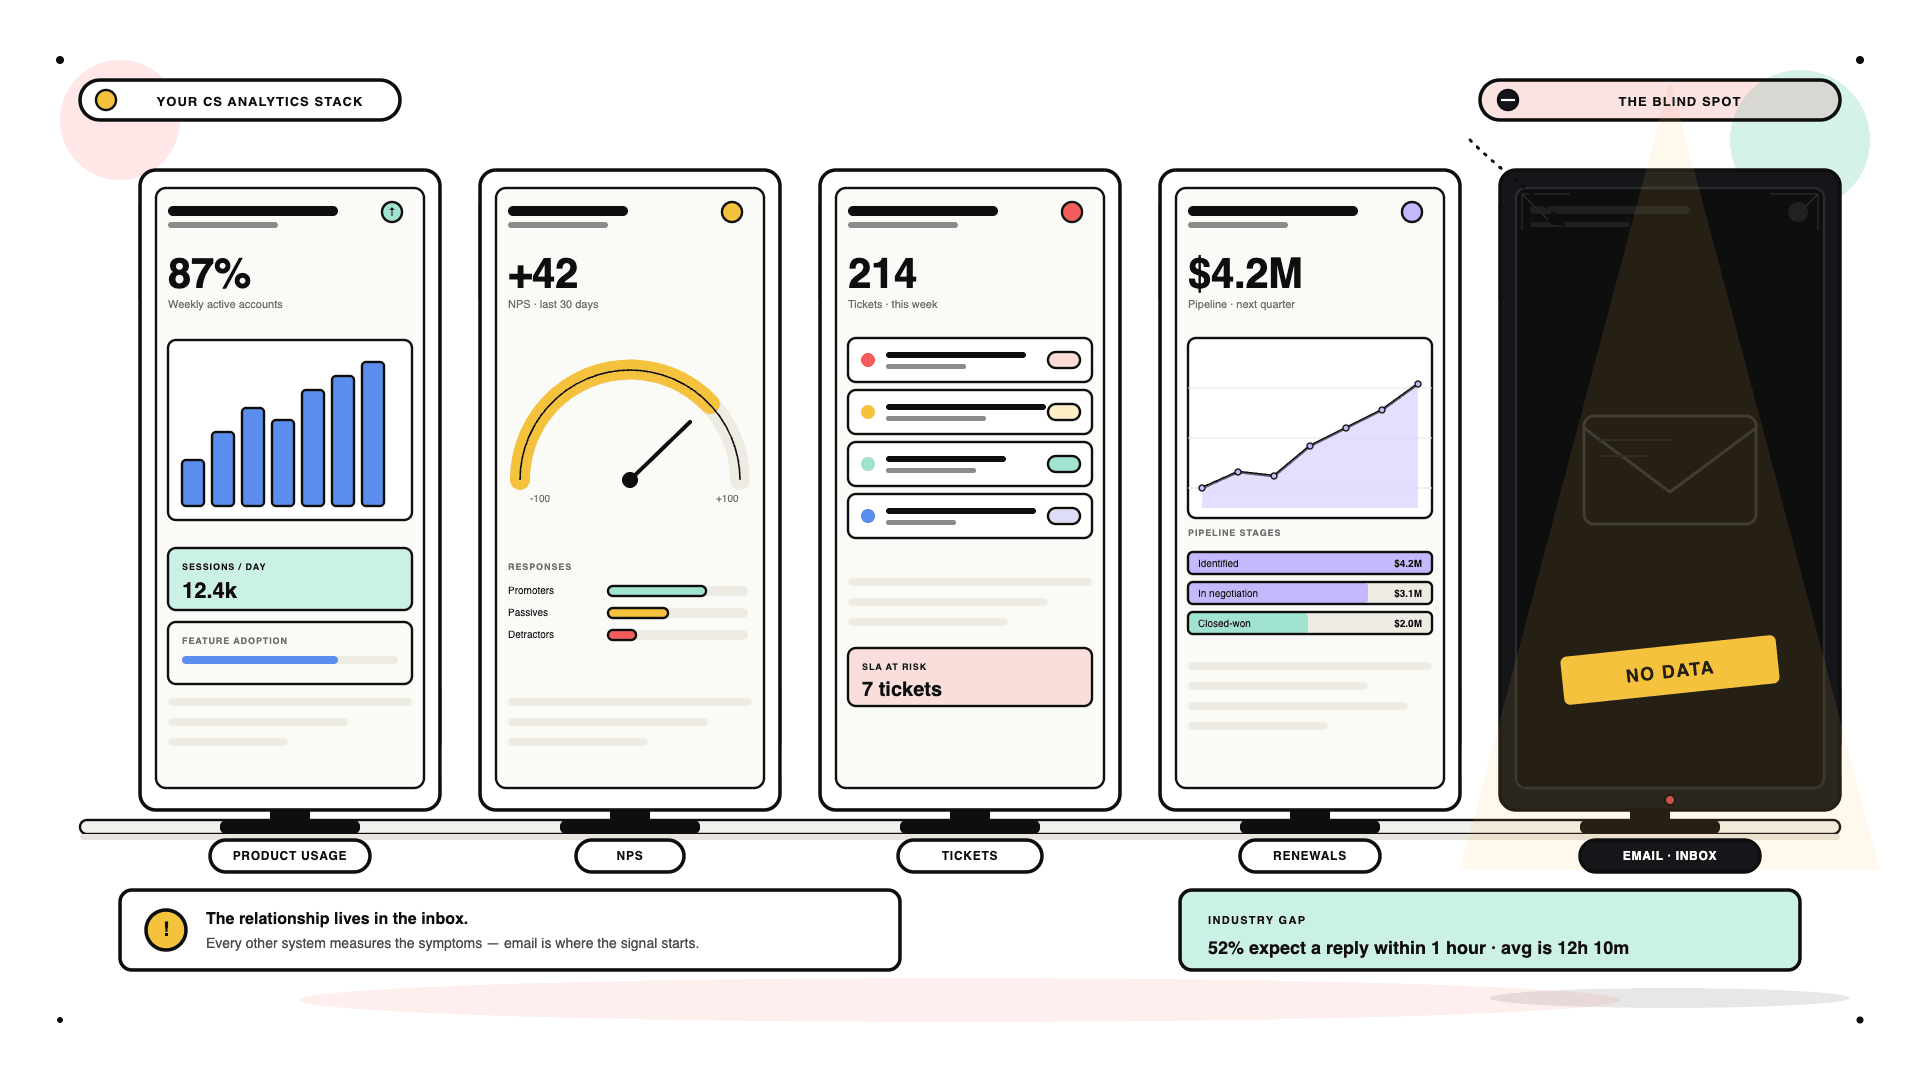
Every manager knows email is important. Few can tell you how their team actually handles it.
How long do customers wait before getting a reply? Which team member is responding in 20 minutes while another takes 18 hours? How many emails went unanswered last week and which clients are at risk because of it?
These questions should have clear, data-driven answers. For most teams, they don't because Gmail and Outlook don't provide them natively. Email sits at the center of how businesses communicate, yet it remains one of the least measured activities in any organization.
That's what email analytics changes.
This guide covers everything a team manager needs to know about email analytics: what it is, which metrics actually matter, how to use the data by team type, how to build a strategy, and how to avoid the mistakes that make analytics efforts useless. Whether you manage a customer support team, a sales team, or an operations function, the same principle applies: you can't improve what you don't measure.
By the end of this guide you'll know exactly which metrics to track, how to interpret them, and how to turn email data into decisions that improve your team's performance.
What are email analytics?
Despite being the most widely used way to communicate in business, there's very little offered in terms of native email analytics. With a billion people relying on email to get work done every single day, most teams still can't answer basic questions about how they use it:
- How many emails did your team send or receive last month?
- Who do you interact with the most?
- How long does your team take to reply?
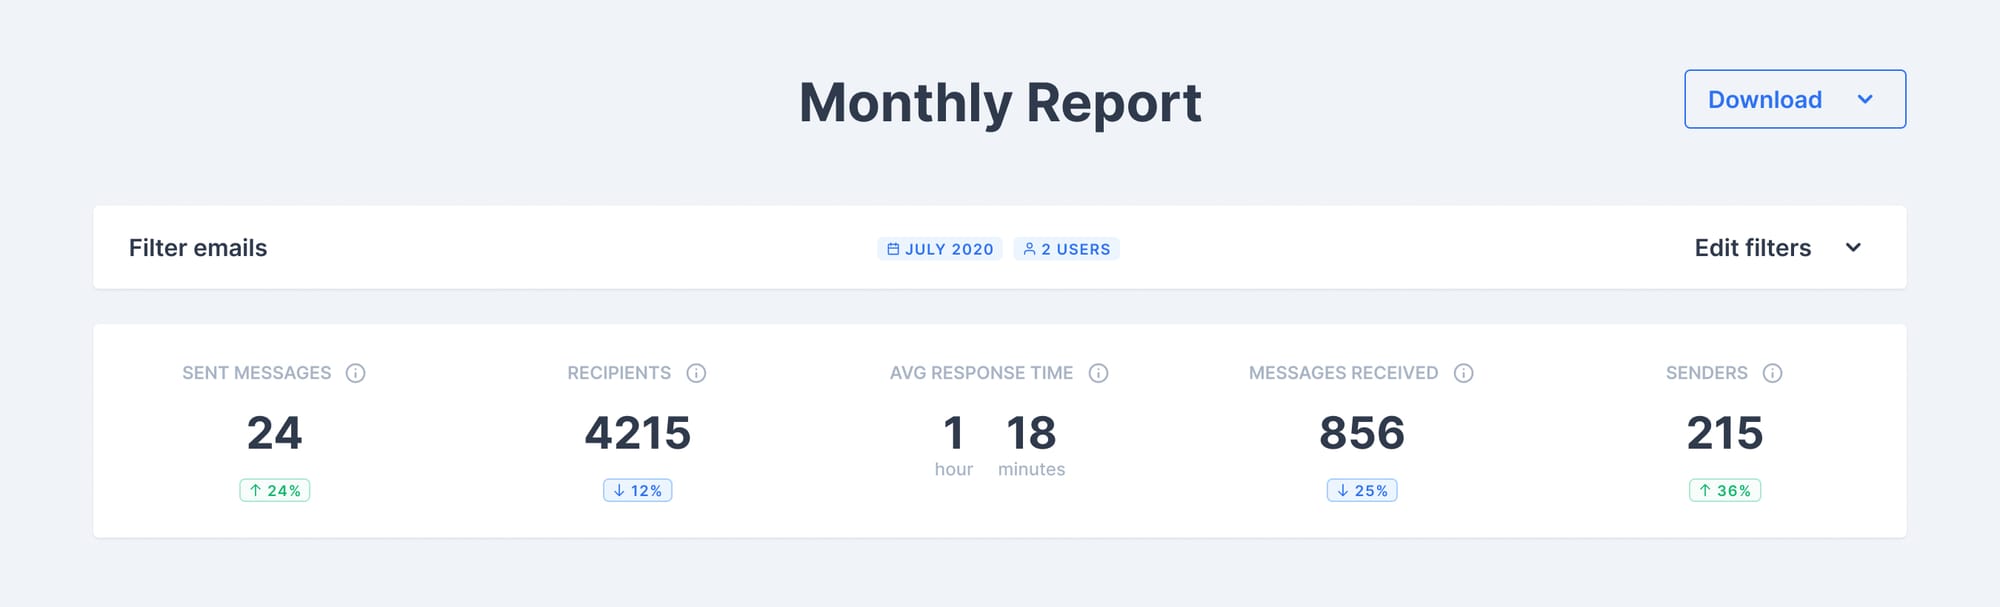
Email analytics answer these questions by pulling raw data from your inbox and visualizing it in a way that gives you actionable insights, turning a cluttered inbox into measurable, comparable performance data.
More precisely, email analytics is the collection and analysis of data about email activity. It tells you how email is being used, how quickly people respond, how much volume each person handles, which emails go unanswered, and whether your team is meeting its response time commitments.
What is the difference between email marketing analytics and email inbox analytics?
The term "email analytics" covers two very different use cases that are often confused:
Email marketing analytics
Email marketing analytics tracks how recipients interact with campaigns you send: open rates, click-through rates, conversions, unsubscribes. Used by marketing teams with tools like Mailchimp or HubSpot.
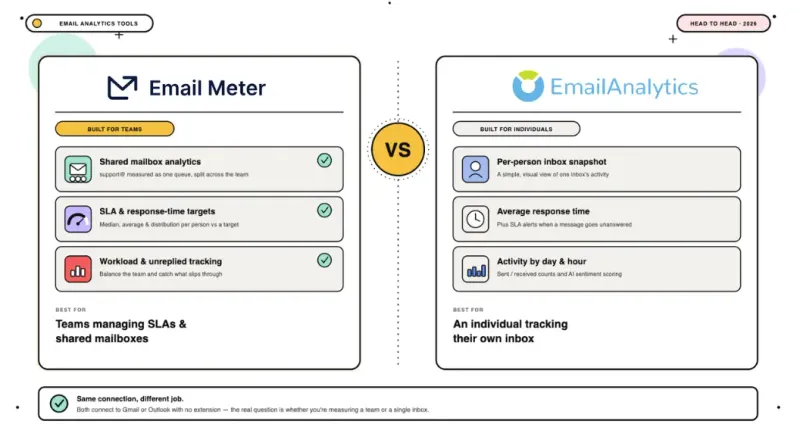
Email inbox analytics
Email inbox analytics tracks how your team handles the emails they receive: response times, SLA compliance, workload distribution, unreplied emails. Used by customer support, sales, and operations managers with tools like Email Meter.
Most content online about "email analytics" focuses on the marketing side. If you manage a team that handles customer or business email, inbox analytics is what you actually need.
What are the benefits of tracking email analytics?
What you can get out of email analytics depends on what you want to achieve. There's no blanket solution, there are many different uses of email and therefore many different ways to analyze and understand how it's used.
Closing more sales
78% of sales go to the company who answers first. Keeping your sales team responding quickly can lead to a significant increase in revenue and email analytics gives you the data to know whether they're actually doing it.
Improving customer satisfaction
61% of customers stop buying from a company due to poor customer service. Your customer service team has a direct commitment to response time. Happy customers are returning customers and email analytics shows you exactly where the gaps are.
Visibility for managers
Work can easily go unnoticed if it lives in each employee's inbox. Email analytics gives managers visibility into who's handling the most volume, who's responding fastest, and who's struggling, without micromanaging. It's the data that makes workload balancing and performance conversations possible.
Understanding remote team performance
Without face-to-face interaction, it's hard to know when and how your team is working. Email analytics gives managers objective data on activity patterns, response times, and productivity, regardless of where the team is located.
Making sure nothing slips through the cracks
If a team is closely monitoring their email analytics, they can make sure every received email is taken care of quickly, so no important message or potential lead gets missed.
What email analytics metrics should teams track?
There's a wide range of email metrics available. Here are the most important ones for teams managing customer or business email.
What is email response time and why does it matter?
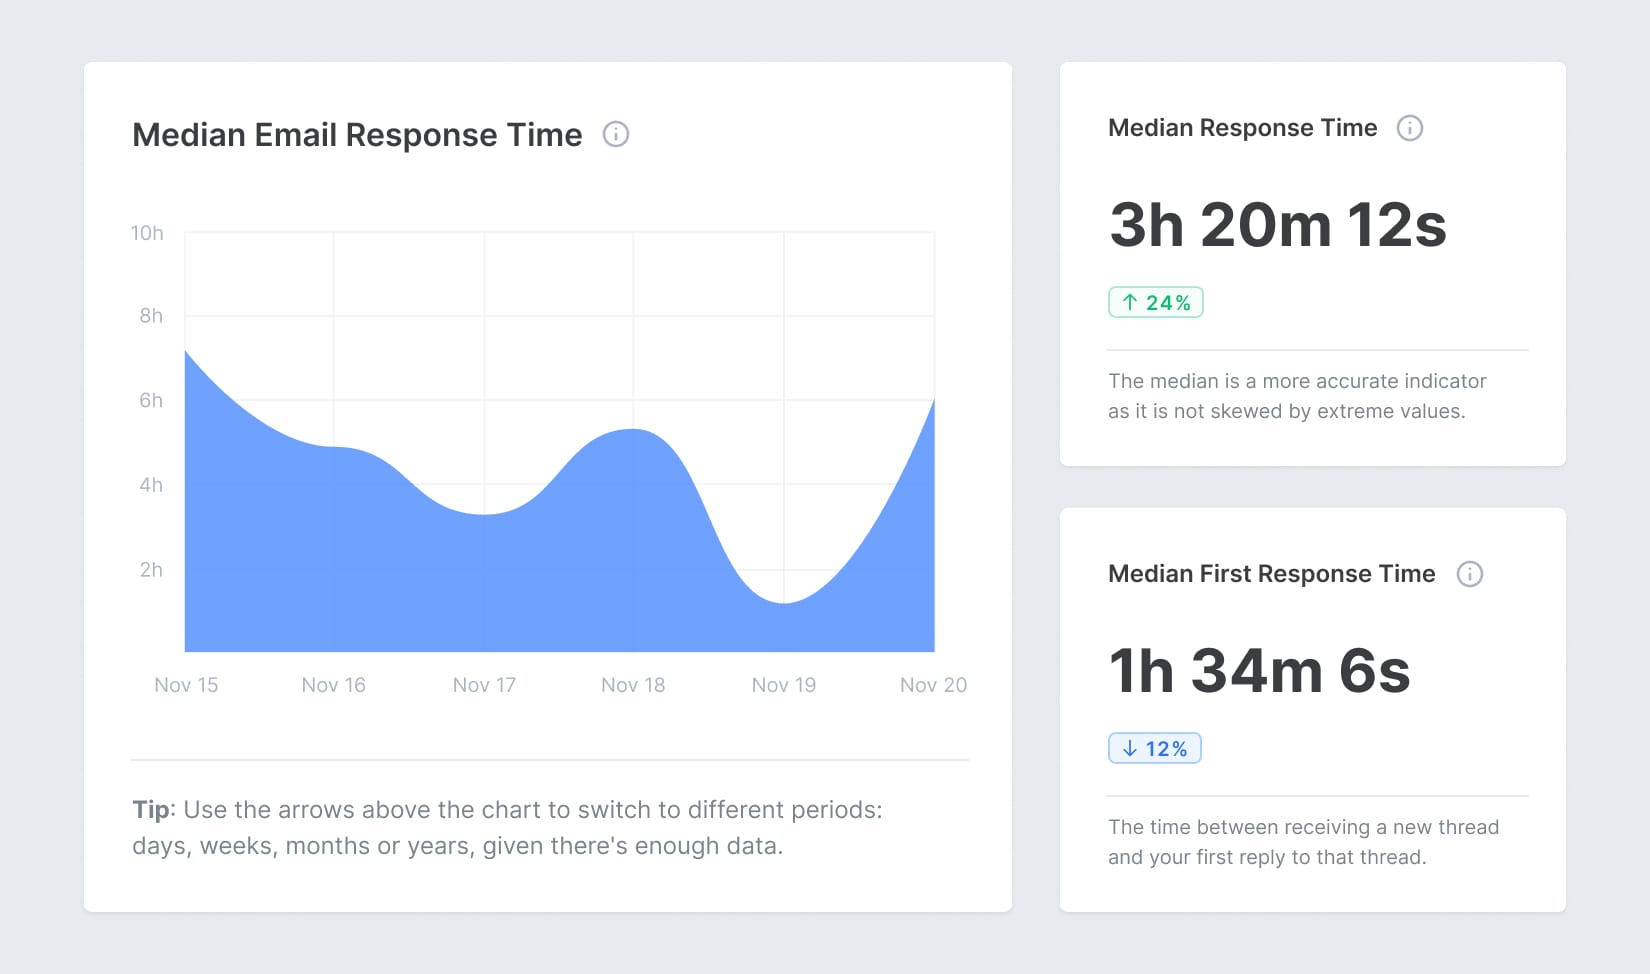
Email response time measures how long people wait on average for a reply from your team. It's calculated by measuring the time between receiving an email and the response being sent.
Response time is likely the first metric any sales or customer support manager thinks of. It gives you a clear insight into how long customers are waiting — and it's directly tied to closed deals and customer satisfaction. The average business email response time is 12 hours. Yet 89% of customers expect a reply within 1 hour. That gap costs revenue.
Real-world result: Payday HCM discovered their support team was responding in 5 hours, well above their 2-hour SLA. By tracking and sharing response time data, they cut it in half within months. "What gets measured, gets changed." — Lisa Reynolds, Operations Manager
You can also track median response time to avoid your data being skewed by outliers, one email sitting unanswered for three days can distort an otherwise healthy average.
For benchmarks by team type and industry, see our email response time guide.
What is first response time (FRT)?
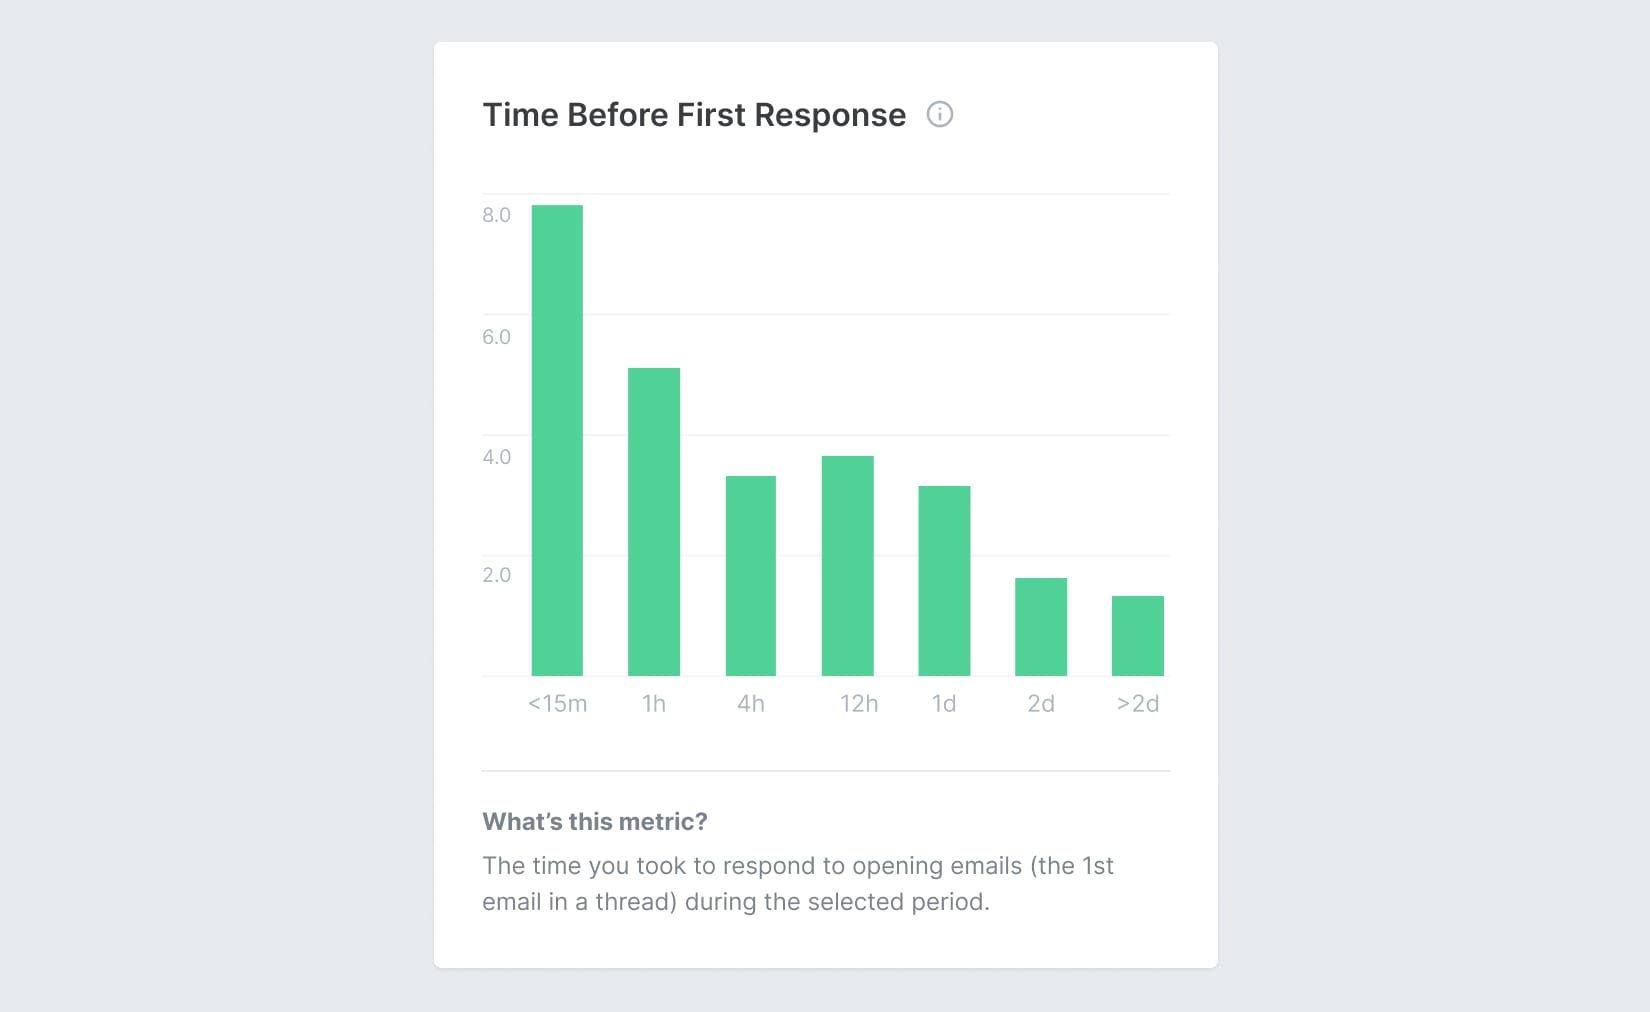
First response time measures how long a customer waits after first reaching out before receiving any reply. Once that first response is received, they know they're being listened to making this one of the most important metrics for customer satisfaction and sales conversion.
What is SLA compliance rate?
SLA compliance rate measures what percentage of emails are answered within your defined target window: for example, "90% of customer emails replied to within 4 hours." This is the metric that connects email performance to client contracts and service commitments. Without it, SLA commitments are aspirational. With it, they're measurable.
For benchmarks on SLA response times by priority level, see our SLA response time guide.
What is email volume per team member?
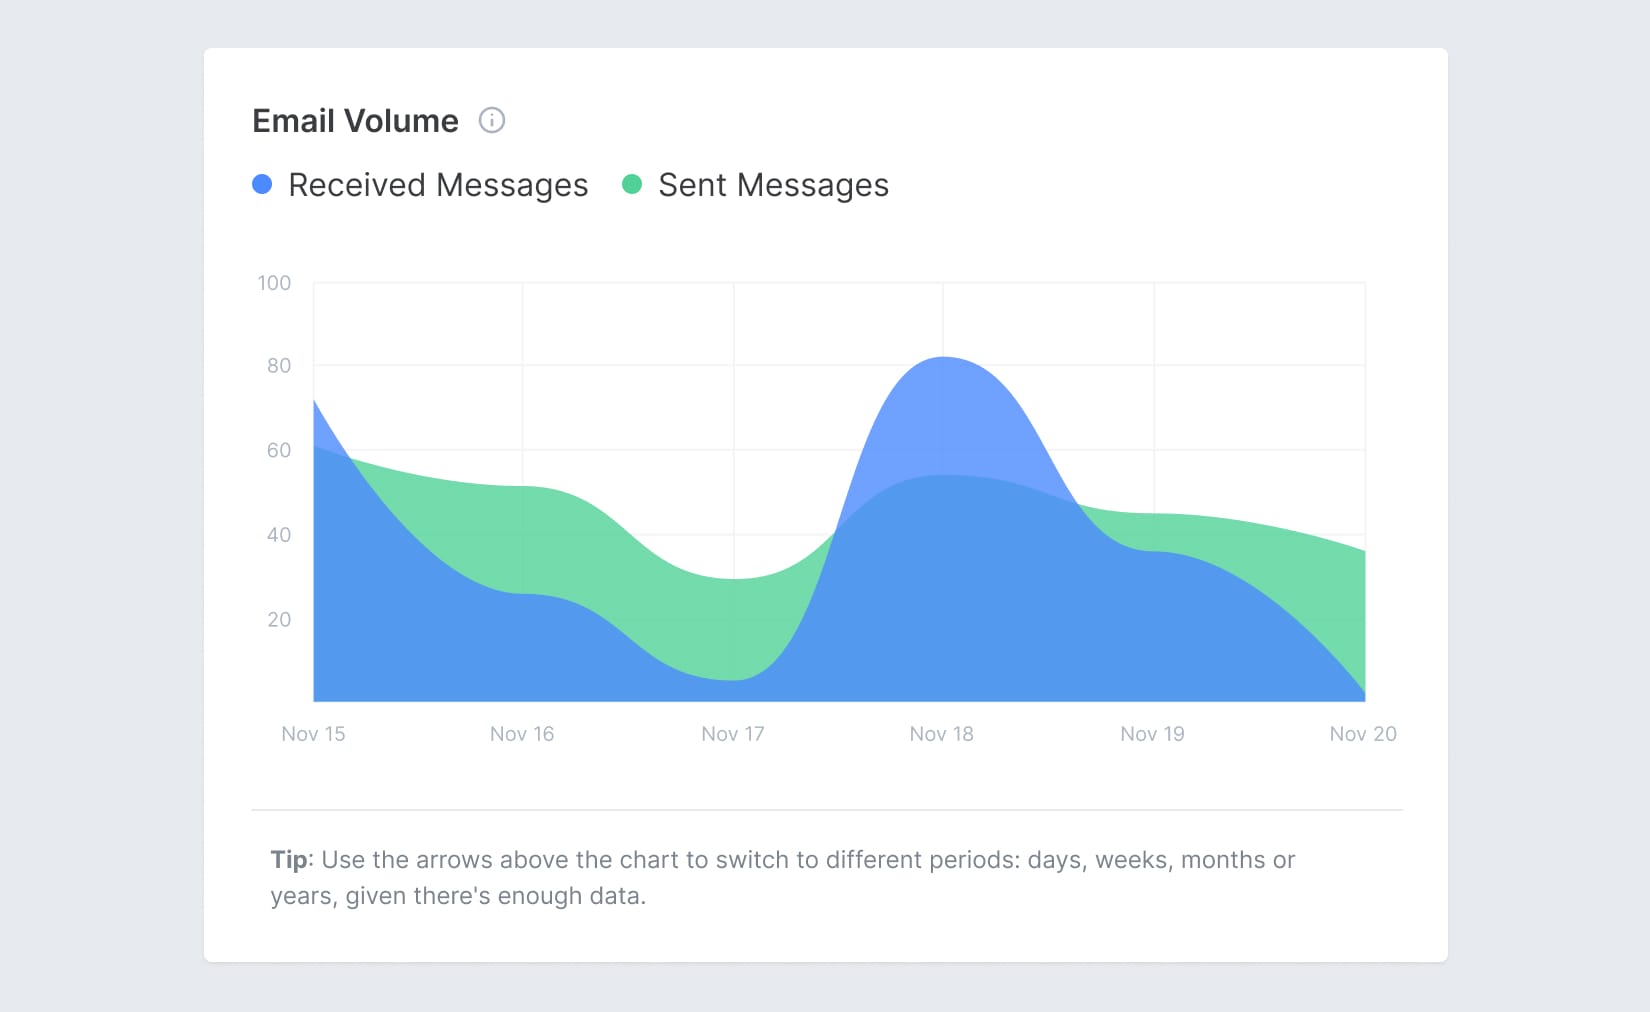
Email volume tracks how many emails each team member sends and receives. If a large number of emails are coming in, your team's workload is increasing and response time could drop. If one team member is handling 150 emails a day while another handles 40, that's a distribution problem, not a performance problem.
What is unreplied email rate?
Unreplied email rate is the percentage of inbound emails that received no reply at all. Often the most revealing metric, most teams are surprised how many threads fall through the cracks.
What are busiest hours?
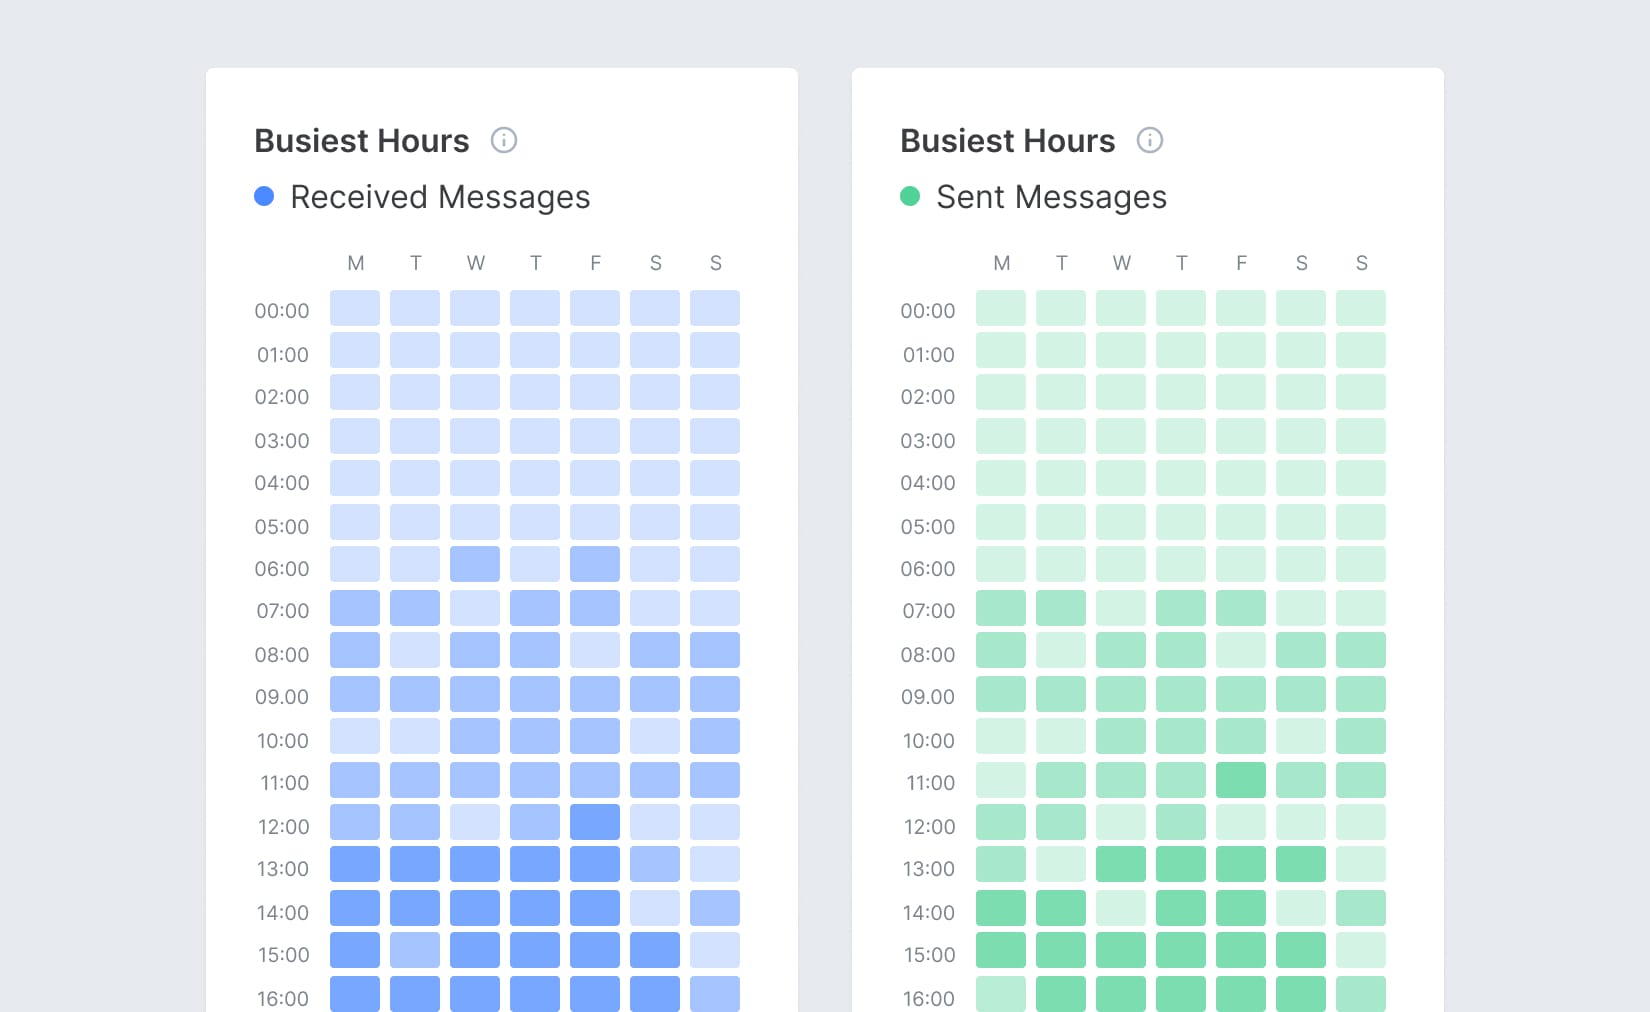
Busiest hours shows when your inbox is most active both for incoming emails and outgoing replies. If 40% of your emails arrive Monday morning and your team is in an all-hands meeting, you have a structural problem. This data drives staffing decisions.
What is response rate?
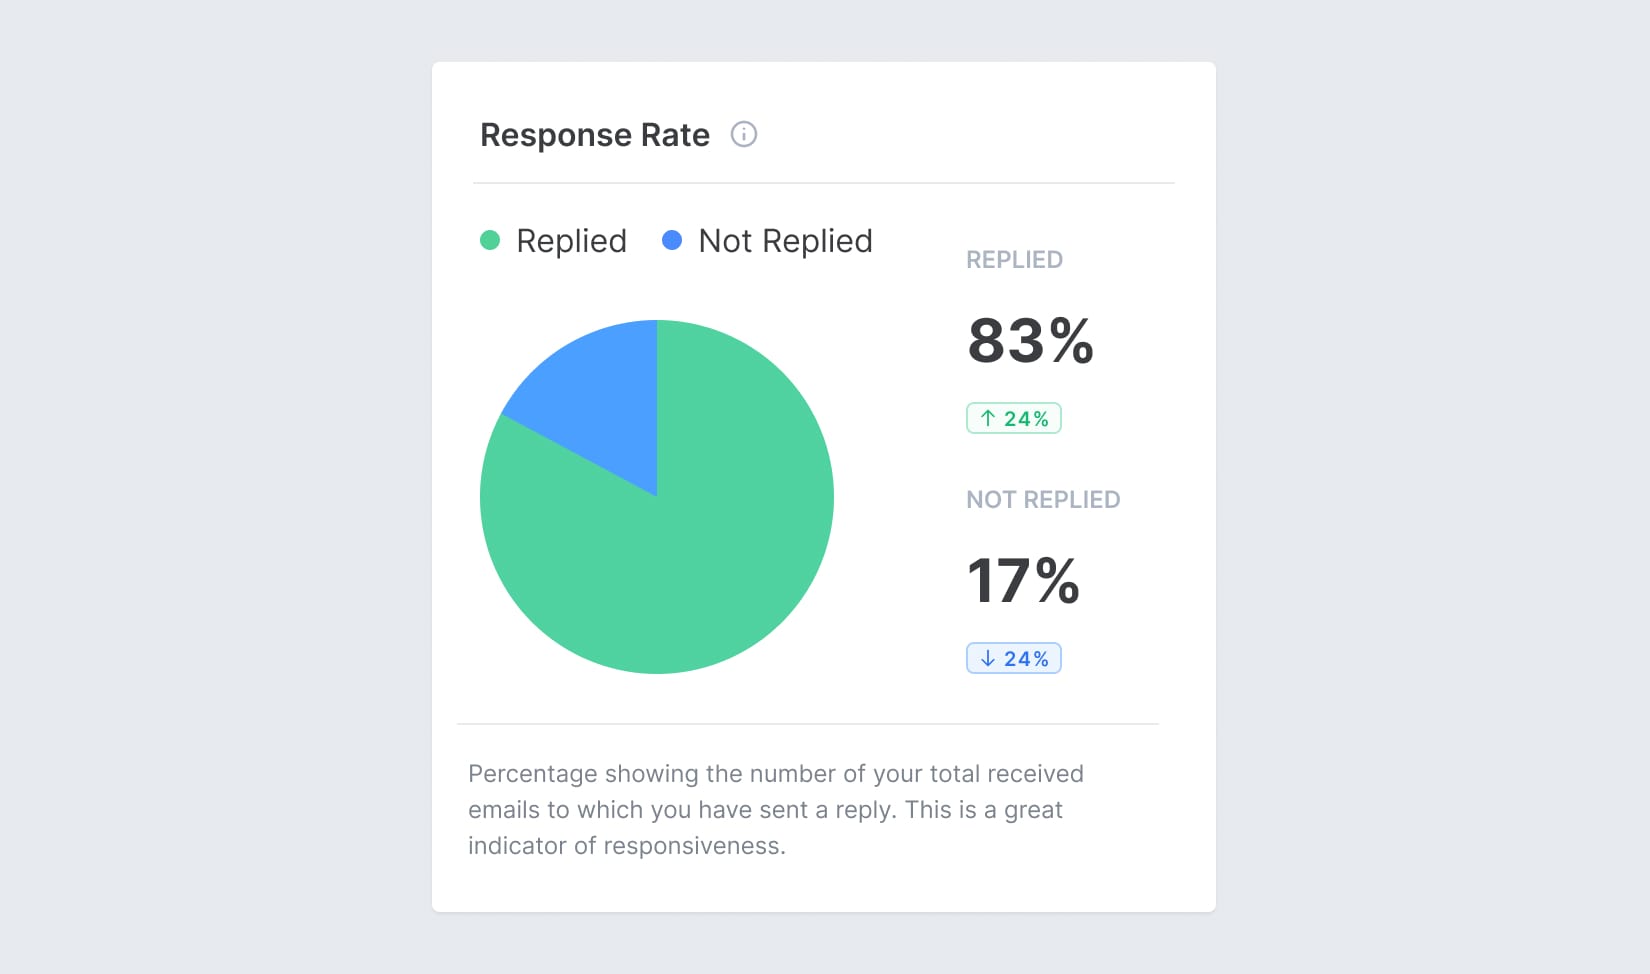
Response rate measures what proportion of received emails your team actually replies to. For teams who need to reply to all (or most) incoming emails, this metric shows whether everyone is being responded to.
What is thread length?
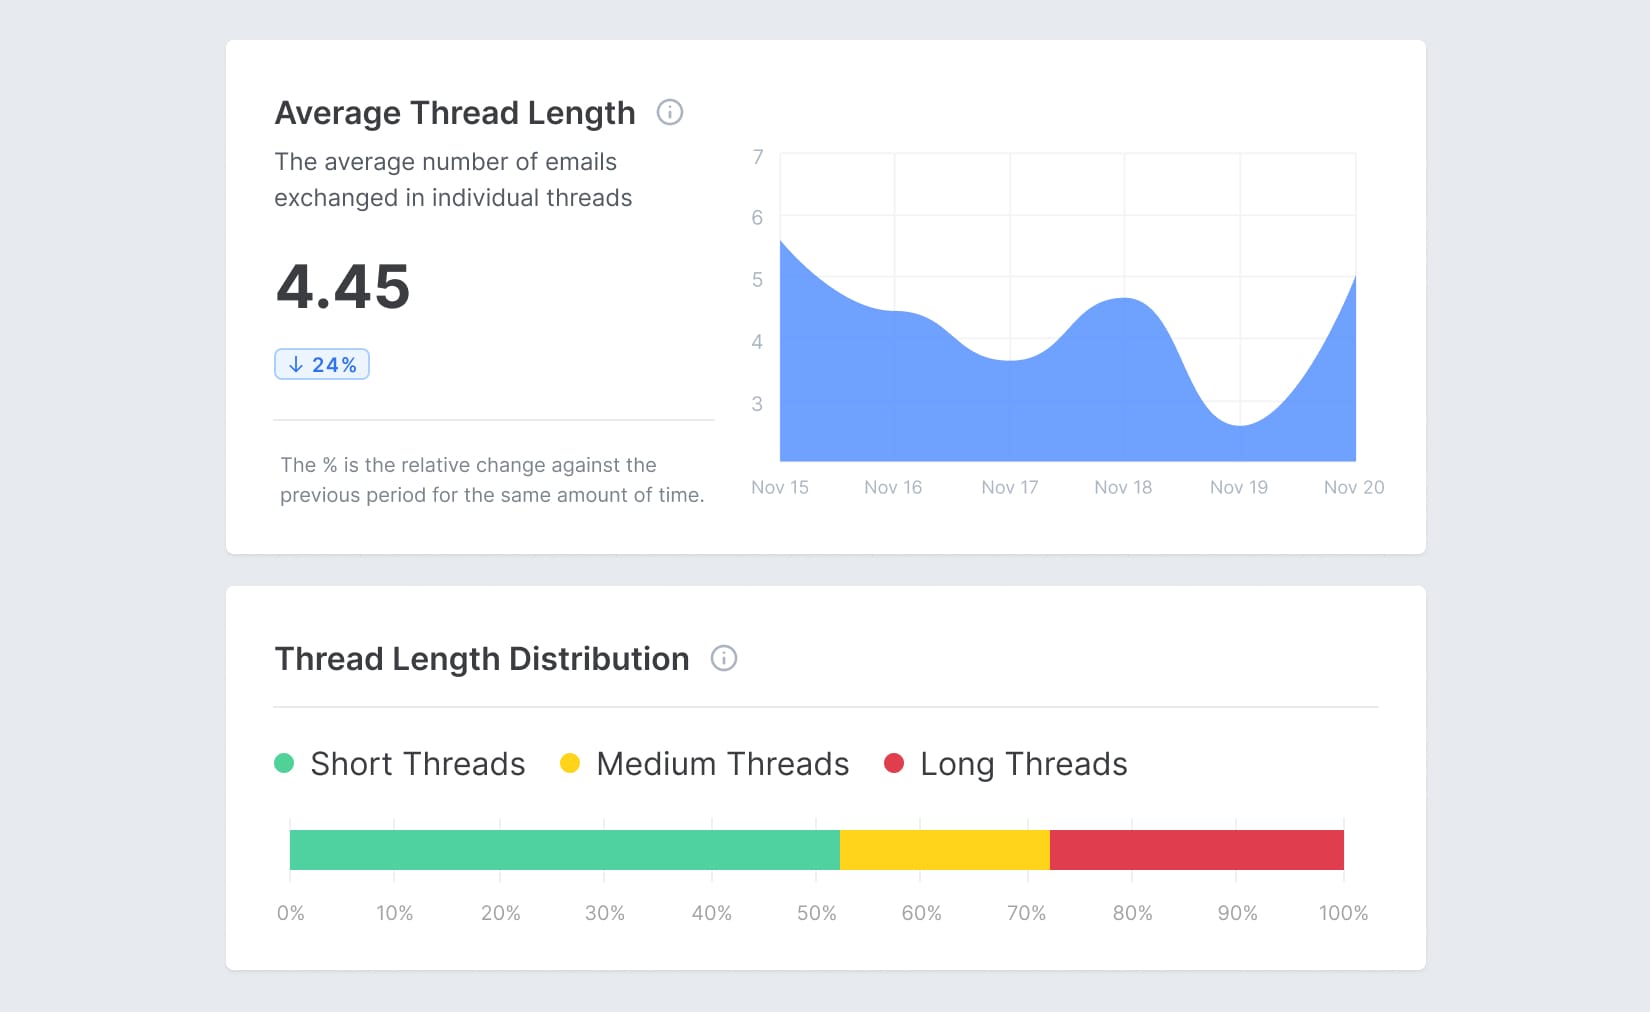
Thread length measures how many messages are exchanged in a conversation. Customer service teams want to keep thread lengths short, longer threads mean more back-and-forth and less efficient resolution.
What are top senders and recipients?
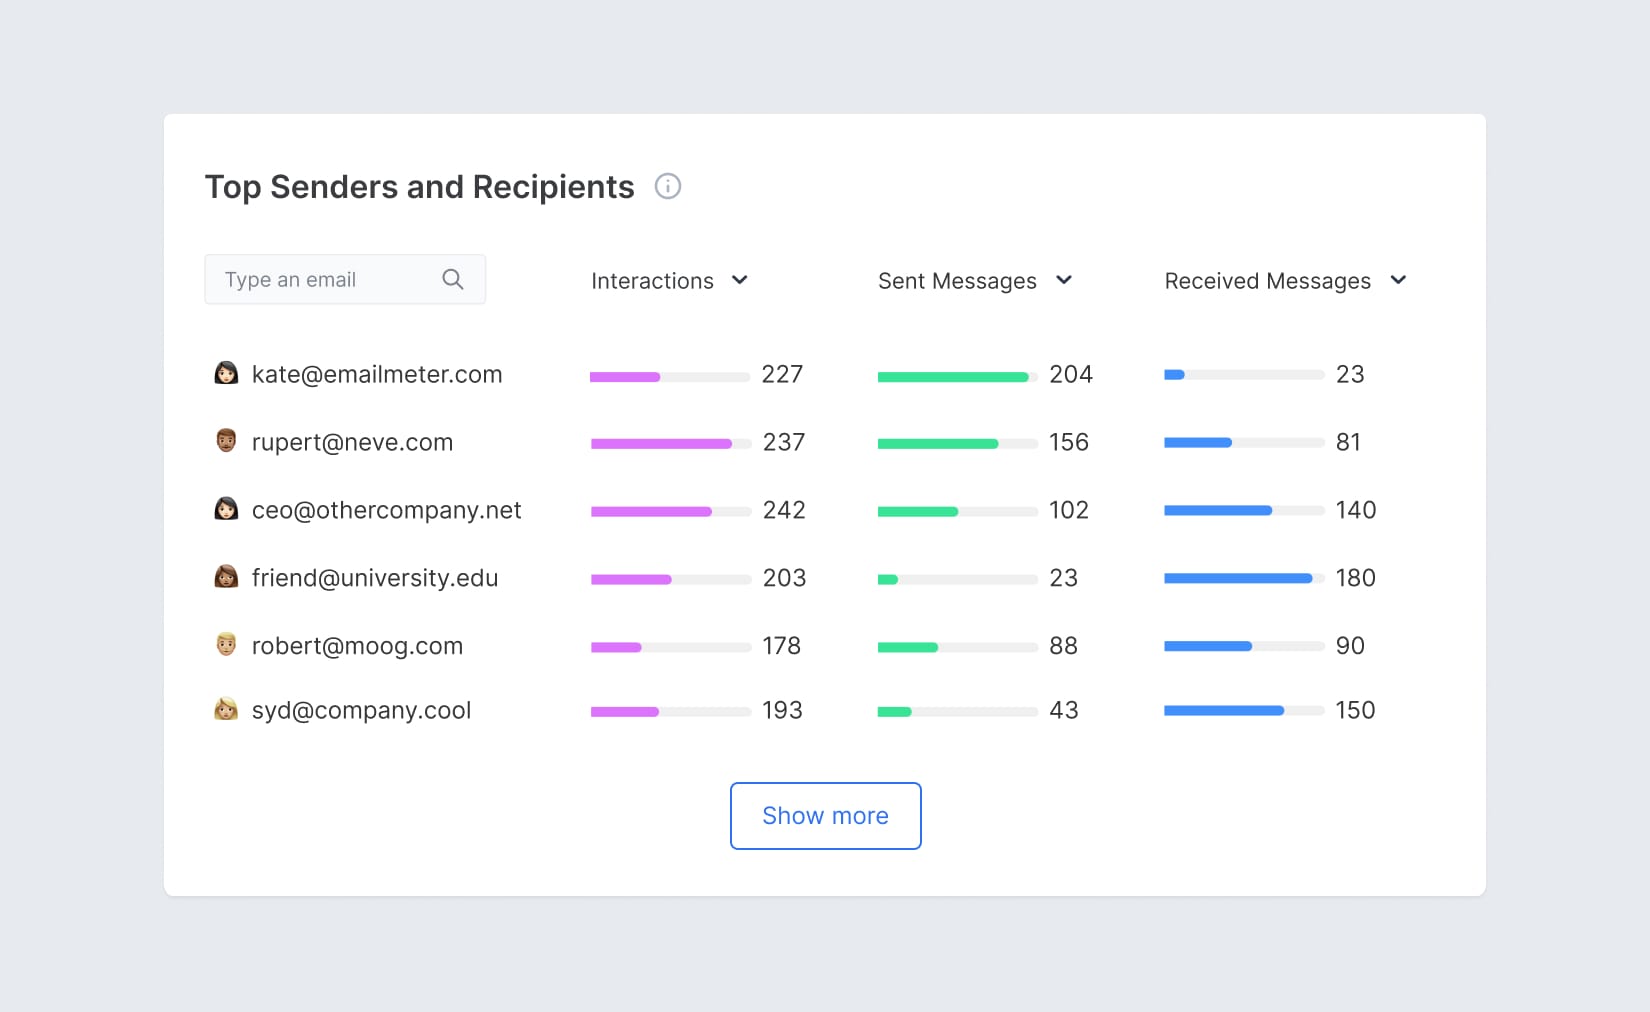
Top senders and recipients shows who you interact with the most, your most demanding clients, your most communicative team members, and where most of your time is spent.
What is internal vs external email breakdown?
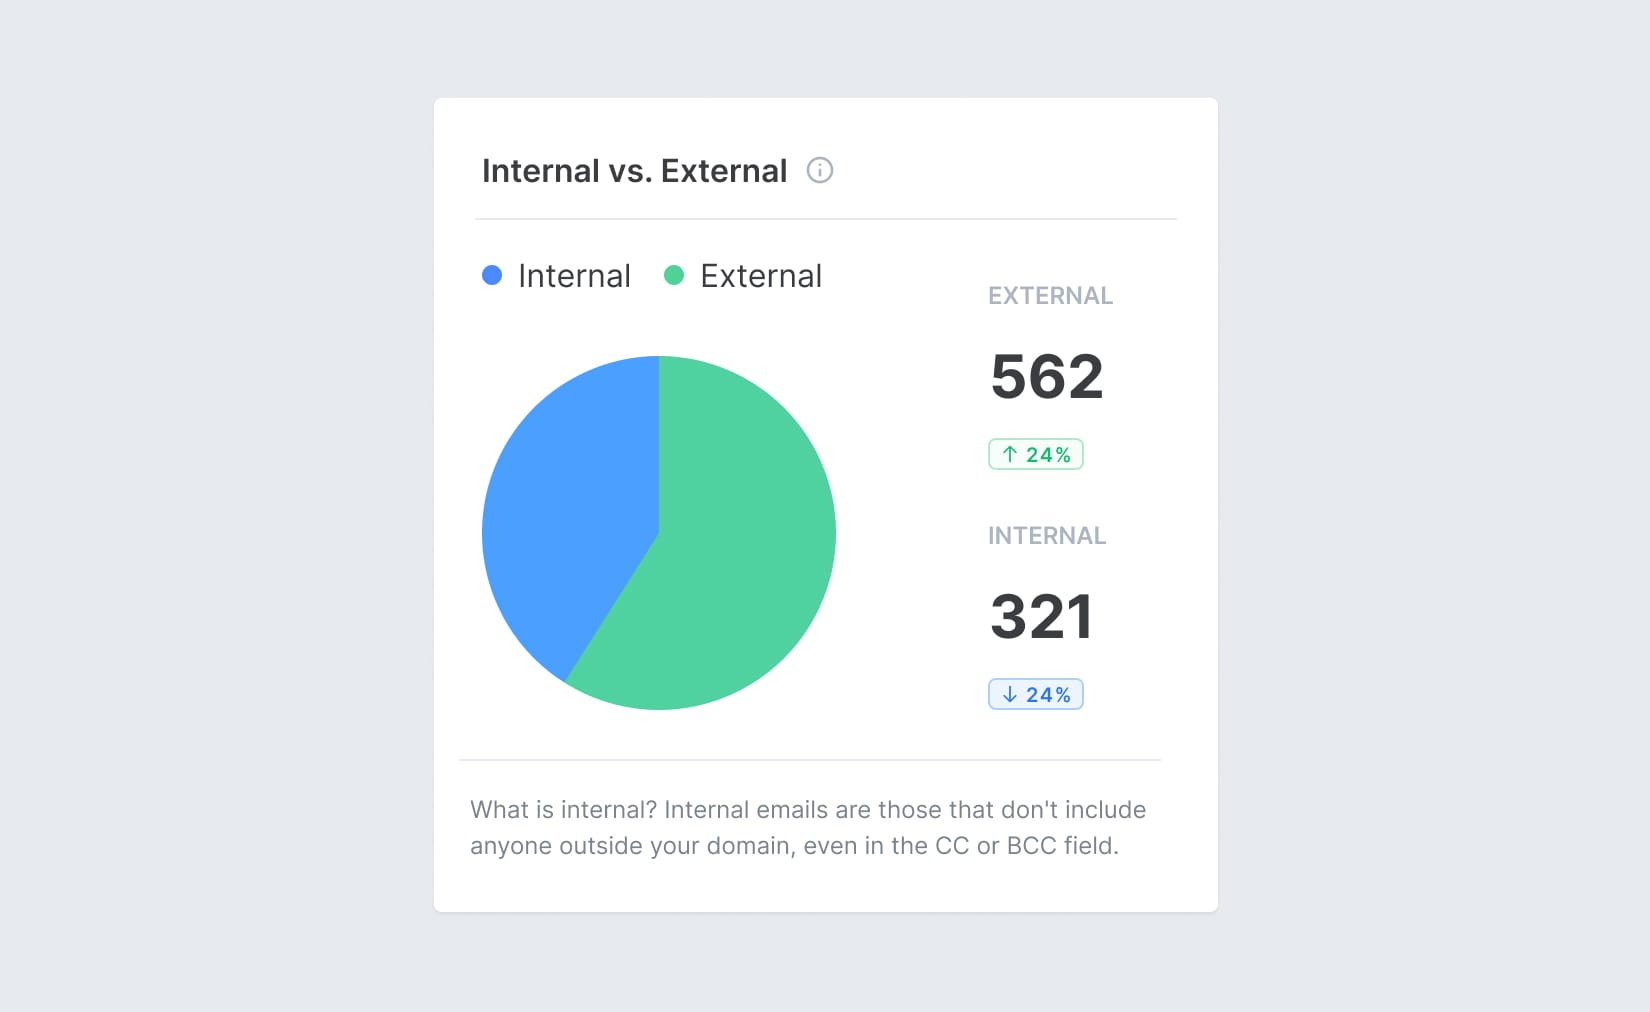
Internal/external breakdown shows how much communication stays within your organization versus going to external contacts.
Why does data quality matter in email analytics?
Not all email analytics tools provide equally reliable data. The difference between accurate insights and misleading data often comes down to how the tool collects its data.
What data quality features should you look for?
Direct API integration
The best tools connect directly to your email provider's API (Gmail API or Microsoft Graph API for Outlook). This ensures complete data capture without relying on read receipts, which recipients can decline.
Real-time data
Data should be collected in real-time, not delayed by hours or days. This ensures metrics reflect actual performance.
Automated data aggregation
The tool should automatically aggregate data across multiple email accounts without manual intervention.
Advanced filtering
The ability to filter data by time period, sender, recipient, or custom parameters ensures you're analyzing relevant information, not noise.
What happens with poor data quality?
Poor data quality leads to wrong decisions:
- Inaccurate workload assessment — you might think someone is overloaded when they're not
- Poor resource allocation — you might hire based on incomplete information
- Missed patterns — without accurate data, you can't pinpoint where processes break down
Example: If your analytics tool relies on read receipts (which many recipients block), you might think emails aren't being read when they actually are. This leads to false conclusions about team performance.
Email Meter uses direct API integration with the Gmail API and Microsoft Graph API, bypassing the limitations of native reporting and ensuring complete, accurate data.
What is sentiment analysis in email analytics and why does it matter?
Email analytics tools typically measure what happened, emails sent, response times, volume. Sentiment analysis goes further: it measures how communications are happening, the emotional tone and context behind the words.
What is email sentiment analysis?
Sentiment analysis uses natural language processing (NLP) and machine learning to evaluate the emotional tone expressed in email content. It categorizes emails as positive, neutral, or negative, and can identify more nuanced emotions like frustration, satisfaction, urgency, or confusion.
Why do standard email metrics miss this?
Standard metrics tell you an email was answered in 2 hours. Sentiment analysis tells you the customer's follow-up email carried negative sentiment, meaning the first response didn't resolve the issue. This prompts a more thorough follow-up before the customer escalates.
Six things sentiment analysis reveals that standard metrics can't:
Customer experience insights
Whether customers are satisfied or frustrated after interactions, enabling more proactive service.
Internal communication health
Whether frustration or stress is building within the team before it affects morale or retention.
Prioritization of urgent emails
Flagging emotionally charged or urgent emails so teams can respond to what needs immediate attention first.
Emotional trend tracking
Whether customer or employee sentiment is improving or deteriorating over time.
Communication impact
Whether email communications are building positive relationships or exacerbating issues.
Early churn signals
Identifying customers who are at risk of leaving based on increasingly negative sentiment before they send a cancellation email.
What are the limitations of sentiment analysis?
Sentiment analysis is powerful but not perfect:
- Sarcasm and irony can be misinterpreted
- Emotions are reduced to broad categories, missing subtleties
- Informal language or typos can cause misclassification
- Effectiveness varies across languages
Despite these limitations, sentiment analysis provides valuable context that pure metrics cannot — making it a meaningful complement to standard email analytics.
How do you use email analytics by team type?
Email analytics metrics don't mean the same thing for every team. Here's what to focus on depending on your role.
Customer support teams
For support teams, the metrics that matter most are first response time and SLA compliance rate. Customers who reach out for help are already experiencing friction, every hour of waiting compounds their frustration.
The target most B2B support teams aim for: first response under 4 hours for standard requests, under 1 hour for urgent issues. SLA compliance rate should be reviewed weekly, not monthly, a compliance drop from 95% to 80% in one week signals a structural problem that compounds quickly.
Key metrics to track:
- First response time by agent and by shared mailbox
- SLA compliance rate against defined tiers (P1/P2/P3)
- Unreplied email rate — threads that have received no response after 24h
- Thread length — long threads often indicate unresolved issues or unclear communication
Sales teams
For sales teams, speed is revenue. Research consistently shows that 78% of sales go to the first-responding vendor. Responding to an inbound lead within 5 minutes makes qualification 21x more likely than waiting 30 minutes.
The metric that matters most: first response time to inbound leads. Everything else is secondary.
Key metrics to track:
- First response time to new conversations — broken down by rep
- Response rate on outbound sequences
- Busiest hours — to identify when leads arrive vs when reps are available
- Per-rep breakdown — to spot who's fast and who's consistently delayed
Operations and management teams
For managers and operations teams, the goal is visibility understanding how the organization communicates and where the bottlenecks are.
Key metrics to track:
- Email volume per team member — to identify workload imbalances
- Internal vs external breakdown — how much communication stays inside vs goes to clients
- Busiest hours and days — to inform staffing and scheduling decisions
- Per-member response time — to identify coaching opportunities without micromanaging
For a complete breakdown of benchmarks by team type and industry, see our email response time guide.
How do you build an email analytics strategy?
Tracking email analytics without a strategy tells you what's happening, but not whether it's good or bad, or what to do about it. Here's how to go from zero to a working email analytics system in four steps.
Step 1 — Establish your baseline before setting targets
You can't improve what you haven't measured. Before deciding what "good" looks like, connect an analytics tool and collect two weeks of data. Look at your actual average response time, your SLA compliance rate, and your unreplied email count. Most teams are surprised, the numbers are almost always worse than expected.
Step 2 — Define targets by email type
Once you have a baseline, define what acceptable looks like for each type of email your team handles:
What matters more than hitting an industry benchmark is consistency, a team that always responds within 6 hours is more trustworthy to clients than one that sometimes replies in 20 minutes and sometimes in two days.
Step 3 — Review weekly, not daily
A 15-minute weekly review using three numbers, SLA compliance rate, average response time, unreplied email count, is more valuable than daily dashboard checks. Consistency matters more than frequency.
Share the data with your team, not just managers. When team members can see their own response time alongside the team average, they self-correct naturally.
Step 4 — Act on the data, not just report it
Analytics only create value when they drive decisions. The three most common actions that follow from email analytics data:
- Workload rebalancing — one team member handling 150 emails/day while another handles 40 is a distribution problem, not a performance problem
- SLA target adjustment — if compliance consistently falls below 80%, the target may be unrealistic for current team size
- Coaching conversations — per-member data makes feedback specific and defensible rather than anecdotal
For a complete guide on building a dashboard to track these metrics automatically, see our email analytics dashboard guide.
How do you interpret email analytics data?
Knowing which metrics to track is only half the job. Here's how to read the numbers correctly and what to do when they're telling you something is wrong.
When average response time is high
High average response time (above 8 hours for customer-facing teams) usually has one of three causes:
Cause 1 — Volume spike.
Check email volume in the same period. If volume increased significantly, response time will follow unless headcount did too.
Cause 2 — Workload imbalance.
Check per-member breakdown. If one person's response time is dragging the average up while others are fast, it's a distribution problem.
Cause 3 — Process issue.
If volume is normal and workload is balanced but response time is still high, look at thread length. Long threads indicate emails requiring multiple back-and-forths, a sign that responses aren't resolving issues on first contact.
When SLA compliance drops
A sudden drop in SLA compliance (more than 10 percentage points in one week) almost always signals a structural issue, a team member out sick, a volume spike, or a new email type that doesn't fit existing workflows.
A gradual decline over several weeks is more concerning, it means the system is drifting, and small inefficiencies are compounding. This is the pattern most managers miss because they're looking at weekly snapshots rather than trends.
When unreplied email rate is high
Unreplied emails are the most revealing metric and the most commonly ignored. A high unreplied rate (above 5%) usually means one of two things: either emails are falling through the cracks because of unclear ownership, or a shared mailbox isn't being monitored consistently.
The fix is almost never "work harder", it's defining who is responsible for which emails and during which hours.
Average vs median — which should you use?
Always read average response time alongside median response time. One email sitting unanswered for three days can distort the average significantly while the median stays healthy. If your average is 8 hours but your median is 2 hours, you have a small number of outliers dragging the average up, not a systemic performance problem.
Email Meter tracks both and lets you choose which to display.
What are the most common email analytics mistakes?
Most teams make the same errors when they start tracking email analytics. Here's what to avoid.
Tracking only the average
Average response time is the most common metric and the most misleading on its own. Always pair it with median response time and per-member breakdown. Otherwise, one slow team member can make a high-performing team look like it's struggling.
Confusing elapsed time with business hours
A 12-hour response time means something very different if the email arrived at 11pm versus 9am. Email Meter calculates both elapsed time (what customers actually experience) and business hours only (a fairer measure of team performance). Decide upfront which one you're measuring and be consistent.
Setting targets without a baseline
Many teams set response time targets based on industry benchmarks before measuring their actual performance. If your team currently averages 18 hours and you set a target of 1 hour, you'll demoralize everyone. Set a target that's challenging but achievable based on your real baseline then tighten it over time.
Reviewing data monthly instead of weekly
Monthly reviews catch problems that have already become expensive to fix. A weekly 15-minute review with three numbers is enough to catch issues early before a compliance dip becomes a client complaint.
Ignoring per-member data
Team averages hide individual problems. A team average of 4 hours might mean one person is consistently responding in 30 minutes while another takes 12 hours. Without per-member data, the slow responder never gets the coaching they need and the fast responder never gets recognized.
Treating email analytics as surveillance
The goal of email analytics is to improve systems, not punish individuals. Teams that use the data constructively, to rebalance workloads, identify bottlenecks, and set realistic targets, see sustained improvement. Teams that use it to micromanage see short-term compliance and long-term resentment.
How do you track email analytics automatically?
Email analytics are a treasure trove of insights just waiting to be discovered, but only if you have the right tool to surface them.
Gmail and Outlook don't provide team-level analytics natively. To track response times, SLA compliance, workload distribution, and per-member performance, you need a third-party tool that connects to your inbox and calculates everything automatically. More efficient workflows mean more time saved, more productivity, more revenue and it starts with having the right data.
Email Meter connects to Google Workspace or Microsoft 365 via API, no browser extension, no changes to how your team works. Whether you're a freelancer working alone or managing a team of 100, Email Meter gives you every insight covered in this guide from a centralized, easy-to-understand dashboard.
It works with most setups and workflows, including shared mailboxes, so no matter how your team is organized, there are insights we can give you.
We're already helping leading companies around the world, including Netflix, Uber, and Roche understand how work happens and keep their teams performing at their best.
Start free → or reach out anytime at hello@emailmeter.com if you can't find what you're looking for.
Go deeper: explore our email analytics guides
Whatever your next step, building a dashboard, comparing tools, or setting up tracking in Outlook or Gmail, here's where to go next.
What metrics should an email analytics dashboard show?
An email analytics dashboard for teams should track six core metrics: average response time, first response time, SLA compliance rate, email volume per member, unreplied emails, and busiest hours. This guide covers what separates a useful dashboard from a vanity metrics display and how to build one in under 5 minutes.
→ Email Analytics Dashboard: What to Track & How to Build One
Which email analytics tool is right for your team?
Not all email analytics tools are built for teams. Many track individual email opens, useful for sales reps, but not what a manager needs to understand how the team is performing. This guide compares the 5 best tools for team-level analytics: response time tracking, SLA compliance, shared mailbox support, and workload distribution.
→ Best Email Analytics Tools for Teams: Ranked & Compared (2026)
What is the best email analytics software for Gmail and Outlook?
If you're evaluating email analytics software specifically for Microsoft 365 or Google Workspace, this guide covers the key features to look for — API integration, customizable dashboards, BigQuery connectivity and compares the top options for both platforms.
→ Best Email Analytics Software for Microsoft 365 and Google Workspace
How do you track email analytics in Outlook?
Outlook and Microsoft 365 don't track team response times, SLA compliance, or workload distribution natively. This guide covers what Outlook analytics can and can't do and the best tools to fill the gap, compared by features and price.
→ Outlook Email Analytics: What It Tracks, What It Misses & Best Tools
How do you set up email tracking in Outlook step by step?
A practical, step-by-step guide to tracking emails in Outlook, from native read receipts and delivery confirmations to setting up automatic response time tracking for your team. Includes what Viva Insights covers and where it falls short.
→ How to Track Emails in Outlook: Native Features & Team Analytics
What are the best Gmail and Google Workspace email analytics tools?
Gmail doesn't provide team-level analytics natively. This guide covers the best tools for tracking email performance in Gmail and Google Workspace, response times, workload distribution, and shared mailbox analytics, compared by features, pricing, and use case.
→ Best Gmail Email Analytics Tools for Google Workspace Teams (2026)
Frequently Asked Questions
What is email analytics?
Email analytics is the process of measuring email activity: how quickly your team responds, how much volume each person handles, and whether you're meeting response time commitments. It exists in two forms: email marketing analytics (campaign performance) and email inbox analytics (team communication performance).
What are the most important email analytics metrics for teams?
First response time, average response time, SLA compliance rate, email volume per member, unreplied email rate, busiest hours, and per-member breakdown. These metrics give managers a complete picture of how their team handles email.
Is email analytics the same as email marketing analytics?
No. Email marketing analytics tracks campaign performance: open rates, click-through rates, conversions. Email inbox analytics tracks team communication performance: response times, SLA compliance, workload. They serve completely different purposes and use different tools.
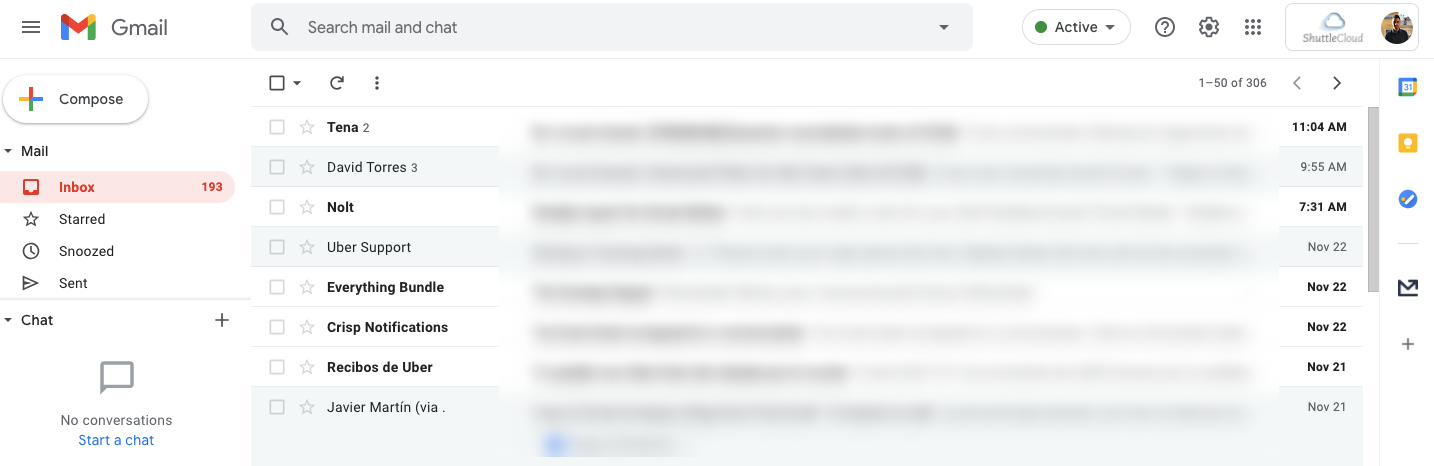
Does Gmail or Outlook provide email analytics natively?
No. Neither Gmail nor Outlook tracks team-level response times, SLA compliance, or workload distribution natively. Third-party tools like Email Meter connect to both platforms and add this layer of analytics automatically.
How do I start tracking email analytics for my team?
Connect Email Meter to your Google Workspace or Microsoft 365 account. It starts calculating response time and volume data from your existing email history immediately, setup takes under 5 minutes. Free plan available.
What is the difference between average and median response time?
Average response time is the mean across all emails, easily skewed by outliers. Median response time is the midpoint, more reliable because one email sitting unanswered for 3 days won't distort the whole picture. Always read both together.
How often should you review email analytics data?
A 15-minute weekly review using three numbers, SLA compliance rate, average response time, unreplied email count, is more valuable than daily dashboard checks. Monthly reviews catch problems too late. Weekly reviews catch them before they become client complaints.
Is there a free email analytics tool for teams?
Yes, Email Meter has a free plan that includes basic response time tracking and email volume data. No credit card required. It's the only tool in this category with a genuinely useful free plan for team analytics, not a 14-day trial, but a permanent free tier you can use indefinitely. Start free →
What is sentiment analysis in email analytics?
Sentiment analysis uses AI and natural language processing to evaluate the emotional tone of emails, categorizing them as positive, neutral, or negative. It helps identify customer dissatisfaction, internal team stress, and urgent emails that need immediate attention, insights that pure metrics like response time can't reveal. Email Meter includes sentiment analysis as part of its analytics platform.