How to Monitor a Shared Mailbox: Response Times, Workload & SLA (2026)
Microsoft 365 and Google Workspace don't track shared mailbox performance natively. Here's how to monitor response times, workload distribution, and SLA compliance automatically.

Most teams that use a shared mailbox assume someone is keeping an eye on it. But without data, "keeping an eye on it" means checking whether the inbox looks busy, not whether customers are waiting too long, whether workload is distributed fairly, or whether anything has slipped through the cracks.
This guide covers how to monitor a shared mailbox effectively, what metrics matter, what the native platforms show you (and what they don't), how to set up alerts and audit access, and which tools give you the full picture.
For a complete overview of shared mailboxes and how they work, see our shared mailbox complete guide. For setup instructions, see our shared mailbox in Outlook guide or our Gmail and Google Workspace guide.
Why is shared mailbox monitoring so difficult?
The core problem is simple: Microsoft 365 and Google Workspace are built to deliver and send email, not to measure how well your team is managing it.
What Microsoft 365 doesn't show you natively
Microsoft 365 Admin Center shows basic usage data, mailbox size, number of emails sent and received, last activity date. It does not show:
- How long your team takes to respond to emails
- Which team member is handling the most volume
- How many emails have gone unanswered for 24h+
- Whether you're meeting your response time SLA targets
- Workload distribution across the team
Microsoft Viva Insights tracks personal productivity data for individual users, but it doesn't monitor shared mailbox performance at a team level.
The Exchange Admin Center provides audit logs, who accessed the mailbox, who sent what, who deleted what, but these are compliance tools, not performance monitoring tools. They tell you what happened, not whether it happened fast enough.
What Google Workspace doesn't show you natively
Google Workspace Admin Console shows domain-level email statistics, total emails sent and received, storage usage. It does not provide:
- Response time data for shared mailboxes
- Per-member workload breakdowns
- Unreplied email tracking
- SLA compliance rates
Google Groups Collaborative Inbox shows conversation status (Open, Assigned, Resolved) but provides no analytics on how quickly conversations move through those stages.
What does it cost to not monitor your shared mailbox?
Most teams don't monitor their shared mailbox because they assume someone is keeping an eye on it. That assumption is where the problems start.
You don't know response times.
Without data, "keeping an eye on it" means checking whether the inbox looks busy, not whether customers are waiting too long. Outlook and Google Workspace don't show you how long emails sit unanswered before someone picks them up.
You can't spot workload imbalances.
One team member may be handling 70% of the volume while others handle 10% and without data, no one notices until burnout or quality problems appear.
You miss SLA breaches before they become complaints.
A customer who waits 8 hours for a reply doesn't usually email to say they're unhappy, they just don't come back. By the time a manager realizes response times have slipped, the damage is done.
You have no baseline for improvement.
When something goes wrong, a key client complains, response times spike, teams that don't monitor have no data to diagnose the problem or prove it's been fixed.
The teams that avoid these problems run proactive weekly reviews using three numbers: average response time, unreplied email count, and SLA compliance rate. That 15-minute weekly review catches problems before they become client complaints.
What metrics should you monitor in a shared mailbox?
Response time
How long does your team take to send the first reply to a new email? This is the single most important metric for customer-facing shared mailboxes. It directly affects customer satisfaction and SLA compliance.
What to track:
- Average response time, the mean across all emails
- Median response time, less affected by outliers
- Response time by team member, who is fast, who is slow
- Response time by day and hour, when does performance dip?
Workload distribution
Are emails distributed fairly across the team? Or is one person handling 70% of the volume while others handle 10%?
What to track:
- Emails handled per team member per day/week
- Who is consistently overloaded
- Who has capacity to take on more
Unreplied emails
How many threads have received no response after 24h, 48h, or 72h? This is your early warning system for emails that have fallen through the cracks, before a customer chases you.
SLA compliance rate
What percentage of emails is your team answering within your target window? If your SLA is "reply within 4 hours", are you actually meeting it — for 90% of emails? 70%? 50%?
What to track:
- SLA compliance rate overall
- SLA compliance by team member
- SLA compliance trend over time — is it improving or declining?
Volume trends
Is inbound email growing? Are there specific days or hours with significantly higher volume? Understanding volume patterns helps you allocate staffing correctly and set realistic SLA targets.
How do you track response times in a shared mailbox?
In Microsoft 365
Microsoft 365 does not provide native response time tracking for shared mailboxes. The closest native option is:
Exchange Admin Center, Message Trace: Shows when specific emails were sent and received, but requires manual analysis and doesn't calculate response times automatically.
Power Automate: You can build a flow that timestamps incoming emails and outgoing replies, then calculates response time, but this requires significant setup and ongoing maintenance, and the data lives in a separate system.
The practical answer: Native Microsoft 365 tools are not designed for response time monitoring. For systematic tracking, a third-party tool is required.
In Google Workspace
Google Workspace has no native response time tracking for shared mailboxes. Google Groups Collaborative Inbox shows conversation status but not how long conversations sit in each status.
The practical answer: Same situation as Microsoft 365, native tools don't support response time monitoring. A third-party tool is required.
With Email Meter
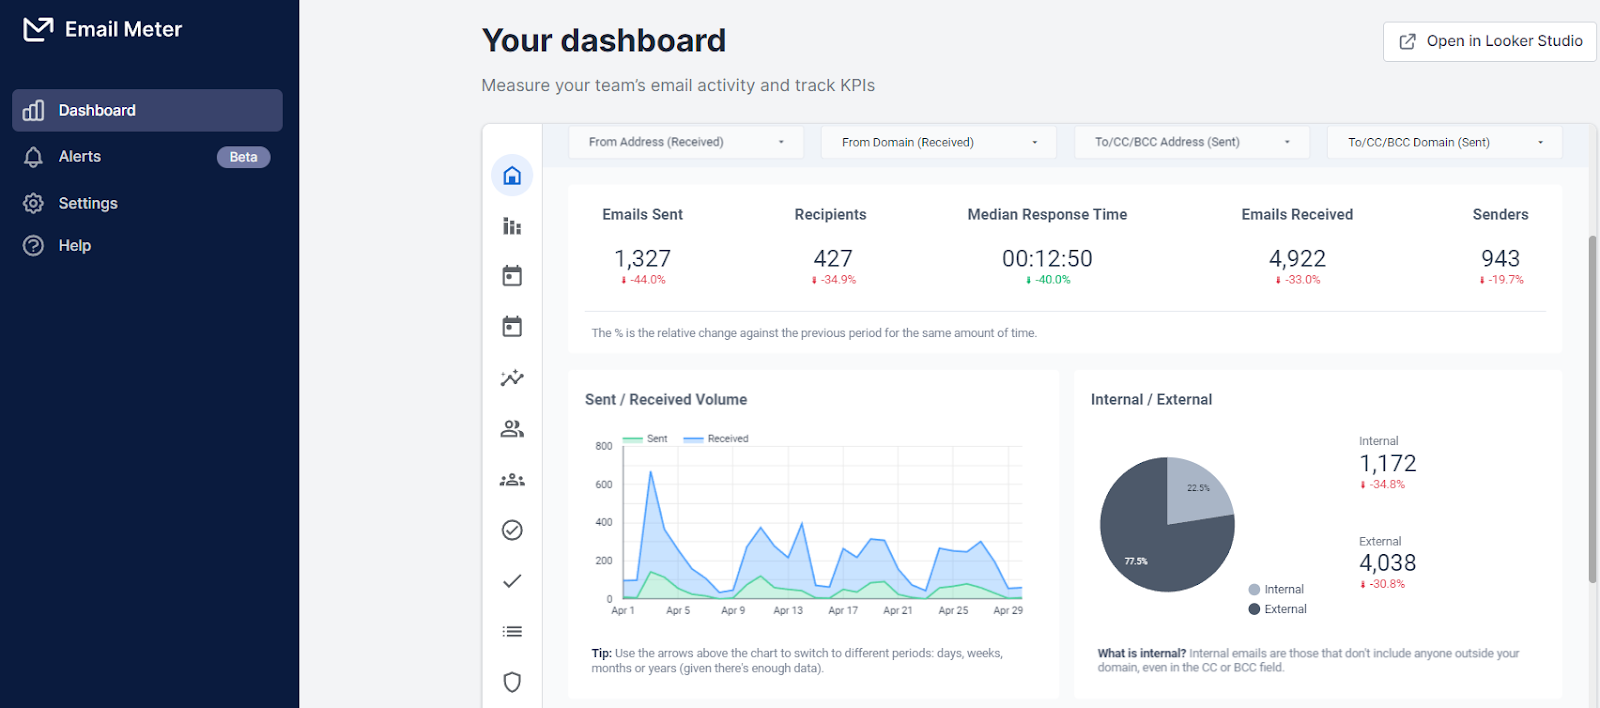
Email Meter connects to your Microsoft 365 or Google Workspace shared mailbox via API and calculates response times automatically, no manual setup, no custom flows, no spreadsheets.
What Email Meter tracks:
- Average and median first response time per team member
- Response time broken down by day, week, or custom period
- Response time trends over time, is the team getting faster or slower?
- SLA compliance rate, what percentage of emails are answered within your target window
Setup takes under 5 minutes. Email Meter reads your existing email data, no changes to how your team works in Outlook or Gmail.
How do you see who accessed or replied in a shared mailbox?
Can you see if an email has been opened in a shared mailbox?
In Microsoft 365, you cannot see natively in Outlook whether a specific email has been read by another team member. However:
- The Exchange Admin Center audit log (under Microsoft Purview) records every action on the shared mailbox, who opened it, who read what, who sent what, who deleted what. This is a compliance tool, useful for auditing but not for day-to-day performance monitoring.
- Email Meter provides a per-member view showing who replied to which emails and when, without needing to dig into audit logs.
In Google Workspace, Google Groups Collaborative Inbox shows conversation assignment, you can see which team member a conversation is assigned to. It does not show who read an email.
How do you audit access to a shared mailbox in Microsoft 365?
To audit who has accessed a shared mailbox in Microsoft 365:
- Go to Microsoft Purview compliance portal (compliance.microsoft.com)
- Navigate to Audit → New Search
- Filter by Activities: Mailbox activities and select the shared mailbox
- Run the search to see a log of all actions, who accessed the mailbox, when, and what they did
This is Microsoft's Non-Owner Mailbox Access Report, available with Exchange Online Plan 1 or higher.
Via PowerShell, Search-MailboxAuditLog :
Filters logs by access type and time period:
Via PowerShell, Get-MailboxStatistics :
Returns basic statistics, number of emails, last logon time, storage usage:
How do you track accountability in a shared inbox?
The most reliable way to track accountability in a shared inbox is to use a system where emails are assigned to specific team members before being handled, not after.
In Microsoft 365 Outlook: Use categories or flags to signal "I'm handling this" before drafting a reply.
In Google Groups Collaborative Inbox: Use the assignment feature, assign conversations to specific team members immediately when they're picked up.
With Email Meter: See per-member reply data automatically, who replied to what, how fast, and how many emails each person is handling, without any manual assignment required.
For best practices on managing shared mailbox accountability, see our shared mailbox best practices guide.
How do you set up alerts and notifications for a shared mailbox?
In Microsoft 365 with Power Automate
Power Automate (formerly Microsoft Flow) lets you build automated monitoring flows for shared mailboxes without writing code.
Useful flows to set up:
Alert for emails older than X hours with no reply:
- Trigger: Email arrives in shared mailbox
- Condition: No reply sent within 4 hours
- Action: Send a Teams message or email alert to the team manager
Daily summary of unreplied emails:
- Trigger: Scheduled — every day at 9AM
- Action: Check shared mailbox for emails with no reply in the last 24h
- Action: Send a summary to the team manager via Teams or email
High-priority email alert:
- Trigger: Email arrives from specific sender or with specific subject keywords
- Action: Send immediate notification to designated team member
In Google Workspace
Google Workspace has more limited native alerting for shared mailboxes.
Google Groups notifications: Members can configure notification settings for new conversations — immediate, daily digest, or none. This is a basic notification, not performance monitoring.
Google Apps Script: For more advanced alerting, Google Apps Script can be used to build custom monitoring flows — similar to Power Automate but requires coding knowledge.
The practical answer: For systematic alerting on unreplied emails and SLA breaches, a third-party tool like Email Meter is significantly more efficient than building custom scripts.
What are the best shared mailbox monitoring tools?
Email Meter, best for response time and SLA monitoring
Email Meter connects directly to your Microsoft 365 or Google Workspace shared mailbox and provides automatic performance monitoring — no setup beyond connecting your account.
What it monitors:
- Average and median response time per team member
- Workload distribution — emails handled per person
- Unreplied email tracking — threads with no response after 24h+
- SLA compliance rate — set a target and track automatically
- Volume trends — when is the mailbox busiest?
- Automated weekly reports — delivered to managers every Monday
Real-world result:
- Payday HCM used Email Meter to monitor 5 shared mailboxes handling 200+ daily emails and cut response times from 5 hours to 2 hours, a 71% improvement. "Once you're able to actually see your stats, it gives you the ability to see if you're doing a good job, and who is really doing the work." — Lisa Reynolds, Operations Manager
- Entirety uses Email Meter to ensure they consistently meet their SLAs without manually tracking their shared inbox, response times are monitored automatically across all team members.
- Diversey connected Email Meter's Real-Time Data add-on to see inbox activity by the hour. With these insights, they achieved an over 10% improvement in response rate and over 5% boost in response time management.
Start monitoring your shared mailbox →
Native Microsoft 365 tools
Exchange Admin Center: Compliance auditing — who accessed the mailbox, who sent what. Not a performance monitoring tool.
Microsoft Purview: eDiscovery and compliance features including Non-Owner Mailbox Access Report. Requires E3 or E5 license for full features.
Power Automate: Custom monitoring flows — useful for alerts but requires setup and maintenance.
Viva Insights: Personal productivity data for individual users. Does not monitor shared mailbox performance.
Native Google Workspace tools
Google Groups: Basic conversation status (Open, Assigned, Resolved) and assignment tracking. No response time data.
Google Admin Console: Domain-level email statistics. No shared mailbox performance data.
Google Apps Script: Custom monitoring flows — requires coding knowledge.
Other tools
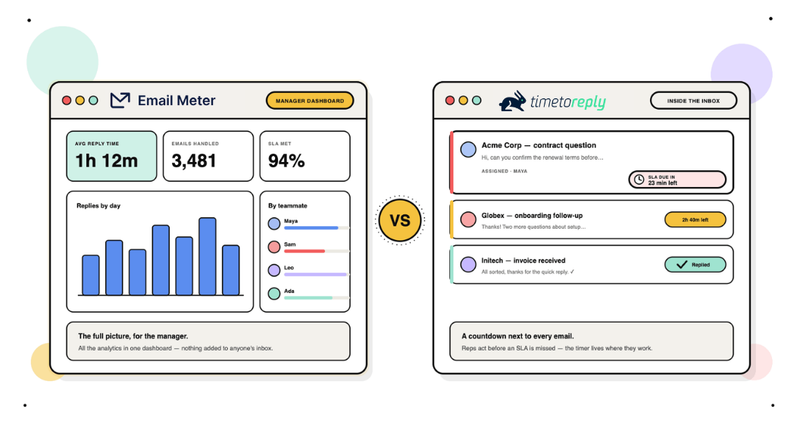
timetoreply: Shared mailbox response time tracking. Gmail and Outlook compatible.
Hiver: Shared inbox management with basic analytics — assignment, status tracking, SLA alerts. Gmail only.
Front: Shared inbox platform with analytics — response time, workload distribution, CSAT. Gmail and Outlook compatible.
For a complete comparison of shared inbox tools, see our best shared inbox tools guide.
What features should you look for in a shared mailbox monitoring tool?
Use this checklist when evaluating shared mailbox monitoring tools:
Response time tracking ✓
- Average and median first response time
- Response time by team member
- Response time trends over time
- Breakdown by day, week, or custom period
Workload monitoring ✓
- Emails handled per team member
- Workload distribution across the team
- Identification of overloaded and underutilized team members
SLA compliance ✓
- Configurable SLA targets
- Compliance rate tracking
- Alerts when SLA is at risk
Unreplied email tracking ✓
- Threads with no response after X hours
- Escalation alerts for long-unanswered emails
Reporting ✓
- Automated scheduled reports
- Manager-level dashboards
- Export functionality
Platform compatibility ✓
- Microsoft 365 / Outlook support
- Google Workspace / Gmail support
- No changes required to existing team workflows
Setup simplicity ✓
- API connection — no IT intervention required
- No browser extension or plugin required
- Works with existing shared mailbox setup
What are quick wins for improving shared inbox performance?
Once you have monitoring data, three quick wins give you immediate improvements without waiting for a full reporting cycle.
Track peak inbox hours
Analyze when most emails arrive to identify your team's peak workload periods. If you see a surge every Monday morning or after 3PM, schedule more agents to be active during those times. Email Meter shows volume trends by day and hour automatically.
Identify the slowest reply chains
Every shared inbox has conversations that drag on longer than they should. Drill into the slowest reply chains to see whether delays are caused by handoffs, lack of ownership, or missing context. These are your highest-impact improvement opportunities.
Compare internal vs external response speed
Not all emails are equal. Internal messages between colleagues are often answered quickly, while external customer emails lag. Comparing the two side by side reveals whether your team is prioritizing the right conversations.
Frequently Asked Questions
How do you monitor a shared mailbox in Microsoft 365?
Microsoft 365 doesn't provide native response time or performance monitoring for shared mailboxes. For compliance auditing, use the Microsoft Purview Non-Owner Mailbox Access Report. For performance monitoring, response times, workload distribution, SLA compliance, use a third-party tool like Email Meter, which connects via the Microsoft Graph API in under 5 minutes.
How do you monitor a shared mailbox in Google Workspace?
Google Workspace doesn't provide native performance monitoring for shared mailboxes. Google Groups Collaborative Inbox shows conversation status and assignment but no response time data. For full monitoring, use Email Meter, which connects via the Gmail API and tracks response times, workload distribution, and SLA compliance automatically.
Can you see who accessed a shared mailbox in Microsoft 365?
Yes, using the Microsoft Purview compliance portal. Go to Audit → New Search, filter by Mailbox activities, and select the shared mailbox. This shows who accessed the mailbox, when, and what actions they took. Requires Exchange Online Plan 1 or higher.
Can you see if an email has been opened in a shared mailbox?
Not natively in Outlook. The Exchange Admin Center audit log records access activity but is not designed for day-to-day monitoring. Email Meter provides per-member reply data showing who replied to which emails and when, a more practical approach for team managers.
How do you set up alerts for a shared mailbox?
In Microsoft 365, use Power Automate to build flows that trigger alerts when emails go unanswered for more than X hours. In Google Workspace, configure Google Groups notification settings or use Google Apps Script for custom flows. For systematic alerting without custom development, Email Meter provides automated unreplied email tracking and weekly performance reports.
What is the best tool for shared mailbox monitoring?
Email Meter is the most comprehensive tool for monitoring shared mailbox performance, response times, workload distribution, SLA compliance, unreplied email tracking, and automated weekly reports. It connects to both Microsoft 365 and Google Workspace in under 5 minutes. From $19/user/month.
How do you track response times in a shared inbox?
Native Microsoft 365 and Google Workspace tools don't calculate response times automatically. Email Meter connects to your shared mailbox via API and calculates average and median response times per team member automatically, broken down by day, week, or custom period.
How do you monitor workload distribution in a shared mailbox?
Outlook and Gmail don't show how many emails each team member is handling from the shared mailbox. Email Meter provides a per-member workload breakdown showing exactly who is handling the most volume, useful for identifying overloaded team members and rebalancing workload before it becomes a performance problem.
Can I track usage per agent in a shared inbox?
Yes, but not natively. Gmail and Microsoft 365 don't break down shared inbox activity by user. Email Meter makes this possible: you can see exactly how many conversations each agent handles, their average response time, and where workload may be unevenly distributed. This visibility helps you reward top performers, coach team members who need improvement, and balance assignments fairly.
Is Email Meter compliant with data privacy laws?
Yes. Email Meter is fully compliant with GDPR, CCPA, and other major data protection regulations. Data is processed securely and never shared with third parties. You maintain full control over what data is connected and can disconnect at any time.