Email Analytics Dashboard: What to Look For and How to Build One
Gmail and Outlook don't show response times, SLA compliance, or who's overloaded. Here's what a real email analytics dashboard should track and how to build one for your team in 5 minutes

If you've landed here, you're probably already convinced that tracking your team's email performance matters. If you're still not sure why — or want to understand the full picture of what email analytics can do for your team, start with our complete email analytics guide first.
This guide focuses on one specific piece of the puzzle: the dashboard. Specifically, what a real email analytics dashboard for teams should look like, what it should track, and how to build one in under 5 minutes.
Because most teams that come looking for an "email analytics dashboard" end up on pages about Mailchimp open rates or HubSpot campaign metrics and leave frustrated. That's not what you need if you manage a customer support, sales, or operations team.
What you need is visibility into how your team handles email, how fast they respond, who's overloaded, which emails are going unanswered. That's what this guide covers.
Two types of email analytics dashboards, which one do you need?
Before diving in, it's important to know that "email analytics dashboard" means two very different things depending on your role:
Email marketing dashboard
Email marketing dashboard tracks campaign performance, open rates, clicks, conversions, bounce rates. Used by marketing teams with tools like Mailchimp, Campaign Monitor, or Looker Studio
Email inbox analytics dashboard
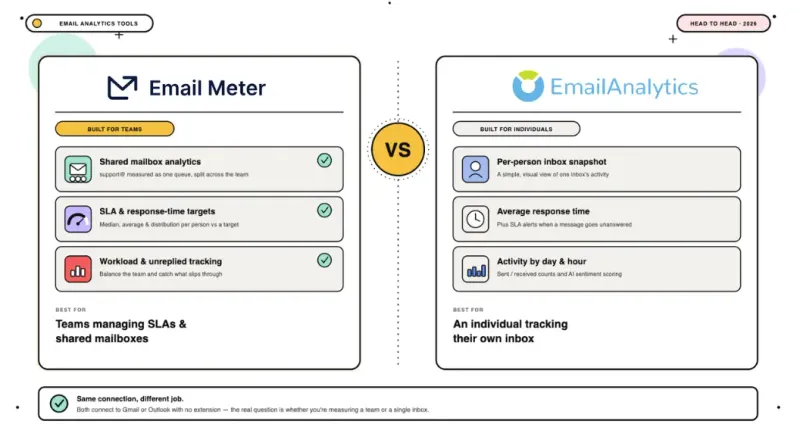
Email inbox analytics dashboard tracks team communication performance: response times, SLA compliance, workload distribution, unreplied emails. Used by customer support, sales, and operations managers with tools like Email Meter.
This guide focuses entirely on inbox analytics dashboards, the type that gives managers visibility into how their team handles email day-to-day. If you're looking for marketing campaign analytics, see our email analytics tools guide.
Why most teams don't have a real email analytics dashboard
Most teams think they have visibility into their email performance. They don't.
Gmail shows you your inbox. Outlook shows you your inbox. Neither shows you:
- How long your team takes to respond on average
- Which team member is handling 60% of the emails
- How many emails have received no reply in the last 48 hours
- Whether you're meeting your SLA targets
Microsoft Viva Insights provides personal productivity data, time spent in email, meeting hours, but it doesn't track team-level response times or shared mailbox performance. Google Workspace Admin offers basic send/receive counts but no response time analytics.
The result: most managers can't properly track email activity across their team, who sent what, when, and how fast. They know response times are "pretty good" or "a bit slow lately", but they can't tell you the number. And shared mailbox monitoring, tracking performance on support@, sales@, or any team inbox — is simply not available natively in either platform.
An email analytics dashboard fixes this. It turns your inbox activity into measurable, comparable, actionable data.
What should a good email analytics dashboard show?
Not all dashboards are equal. Here's what separates a useful email analytics dashboard from a vanity metrics display.
1. Average and median response time
The single most important metric for any team that communicates with customers, leads, or partners. Average response time tells you the mean but median response time is often more useful because it's not skewed by outliers (one email sitting unanswered for 3 days can distort an otherwise healthy average).
A good dashboard shows both, broken down by day, week, and month so you can spot trends.
2. First response time (FRT)
Distinct from average response time, FRT measures how long it takes to send the very first reply to a new conversation. This is what customers actually experience. A team can have a good average response time on ongoing threads but be consistently slow at picking up new ones.
3. SLA compliance rate
What percentage of emails are answered within your defined target window? If your target is "all customer emails replied to within 4 hours", your SLA compliance rate tells you whether you're actually hitting that and how consistently.
Without this metric, SLA commitments are aspirational. With it, they're measurable. For SLA benchmarks by priority level, see our SLA response time guide.
4. Email volume per team member
Who is handling how many emails? Volume distribution reveals workload imbalances that managers often can't see from the inbox alone. One team member sending 150 emails a day while another handles 40 is a resource problem, not a performance problem.
5. Unreplied emails
How many threads have received no response after 24, 48, or 72 hours? This is often the most revealing metric. Most teams are surprised by the number. It's the data point that shows what's falling through the cracks in real time.
6. Busiest hours and days
When does email volume peak? When are response times slowest? This data drives staffing decisions, if 40% of your emails arrive Monday morning and your team is in an all-hands meeting, you have a structural problem that no amount of motivation will fix.
7. Per-member breakdown
All of the above, broken down by individual team member. This is what turns a team-level dashboard into a management tool, you can see who's fast, who's overloaded, and who needs coaching, without micromanaging.
What is an internal email analytics dashboard?
An internal email analytics dashboard tracks how your team handles the emails they receive, as opposed to how marketing campaigns perform externally.
The key distinction: internal email analytics measures team behavior, not recipient behavior. It answers questions like:
- How long does it take our team to respond to a customer?
- Which agent is consistently slow — and why?
- Are we meeting the SLA targets we've committed to?
- Which hours of the day is our inbox busiest?
This is the type of dashboard most relevant to customer support managers, sales managers, and operations leaders. It requires connecting to your Gmail or Outlook account, not to a marketing platform.
How to build an email analytics dashboard for your team
If you want to set up email analytics tracking for your team, here's the process:
Step 1 -Define what you need to measure
Start with two metrics: average response time and email volume per person. These two reveal 80% of your team's email performance picture. Add more only after these are embedded in your weekly review.
Step 2 - Connect your email platform
EmailMeter connects to Google Workspace and Microsoft 365 via API. It starts calculating data from your existing email history immediately, you'll see your baseline within minutes.
Step 3 - Set your SLA targets
Define what "good" looks like for your team before reviewing data. Without a target, the numbers have no meaning. A simple starting framework:
- Customer emails → under 4 hours
- Sales leads → under 1 hour
- Internal emails → same day
Step 4 - Set up automated reporting
Configure weekly reports to go to managers automatically. The goal is to remove the need to log into a dashboard to stay informed. EmailMeter sends a Monday morning report to each manager with the previous week's key metrics.
Step 5 - Review weekly, not daily
A 15-minute weekly review using three numbers, SLA compliance rate, average response time, unreplied email count, is more valuable than daily dashboard checks. Consistency matters more than frequency.
For a complete guide on how to use email analytics data to improve team performance, see our Email Analytics guide.
What Gmail and Outlook show natively (and what they don't show)
The gap is significant. Neither Gmail nor Outlook was built to give managers visibility into team email performance. EmailMeter fills that gap without replacing either platform.
What EmailMeter's dashboard shows
EmailMeter is an inbox analytics dashboard that connects to Google Workspace and Microsoft 365. Here's what it displays:
All metrics are broken down by individual team member, by team, and by time period. You can filter by shared mailbox, by sender, or by date range.
Setup takes under 5 minutes. No changes to how your team works. No browser extension required.
Does Email Meter integrate with CRM systems?
Email Meter connects to Google Workspace and Microsoft 365 via API and exports data via BigQuery connector — making it compatible with most BI tools and CRM systems including Salesforce and HubSpot. This means your email performance data can be combined with your CRM data for a complete view of customer interactions.
For a full comparison of email analytics tools by features and pricing, see our best email analytics tools for teams guide.
See Email Meter's dashboard in action — start free →
Frequently asked questions
What is an email analytics dashboard?
An email analytics dashboard is a centralized view of your team's email performance metrics, response times, volume, SLA compliance, and workload distribution. It turns inbox activity into measurable data that managers can act on.
What metrics should an email analytics dashboard show?
For team inbox analytics: average response time, first response time, SLA compliance rate, email volume per member, unreplied emails, and busiest hours. For email marketing: open rate, click-through rate, bounce rate, and conversion rate. These are two different types of dashboards for two different use cases.
Does Gmail have an email analytics dashboard?
No. Gmail and Google Workspace Admin provide basic send/receive counts but no response time analytics, SLA tracking, or per-member performance data. Tools like EmailMeter connect to Gmail and add this layer of analytics.
Does Outlook have an email analytics dashboard?
Microsoft 365 offers Viva Insights, which provides personal productivity data. However, it doesn't track team-level response times, SLA compliance for shared mailboxes, or per-user performance comparison. EmailMeter fills this gap for Outlook teams. If you're specifically looking for Outlook-compatible tools, we've compared the best email analytics tools for Outlook including pricing and features
How do I set up an email analytics dashboard for my team?
Connect EmailMeter to your Google Workspace or Microsoft 365 account. It starts calculating response time and volume data from your existing email history immediately. Setup takes under 5 minutes, start free here.
What's the difference between an email marketing dashboard and an email inbox analytics dashboard?
An email marketing dashboard tracks campaign performance (opens, clicks, conversions), used by marketing teams with tools like Mailchimp or HubSpot. An email inbox analytics dashboard tracks team communication performance (response times, SLA compliance, workload), used by support, sales, and operations managers with tools like Email Meter.
What is an internal email analytics dashboard?
An internal email analytics dashboard tracks how your team handles the emails they receive, response times, SLA compliance, workload distribution, unreplied emails. It is used by managers who need visibility into team performance, not by marketing teams tracking campaign metrics.