Most teams that set up email analytics run into the same problem six weeks later: they have dashboards full of data and no idea what to do with it.
Response time is 3h 42min. Volume is up 12% this month. SLA compliance is at 78%. Now what?
This guide is about turning those numbers into decisions. Specifically: how to identify problems in your email data, how to act on them, how to coach your team using metrics, and how to report upward with confidence.
If you're still at the "what should I measure?" stage, start with our guide on email analytics for teams first, then come back here.
| Metric | What to look at | How to act on it |
|---|---|---|
| Response time | Median and distribution, not the average | Coach if one person is slower at equal volume |
| Volume | Volume per member, peak hours | Rebalance workloads, staff the peaks |
| SLA compliance | Rate vs target, 15-min weekly review | Work the worst days and members first |
Step 1: Read your response time data correctly
To read response time correctly, look at the median and the distribution, not the average. The average hides the gap between your fastest and slowest responders.
Response time is the most important metric but most managers misread it.
The problem with averages
A team average response time of 3 hours looks fine on paper. But averages hide what's actually happening. One team member responding in 30 minutes and another in 6 hours averages out to 3 hours and 15 minutes, a perfectly acceptable number that masks a serious problem.
What to look at instead:
- Median response time: less affected by outliers than the average. If median is 2 hours but average is 5 hours, a small number of very slow responses are dragging your average up.
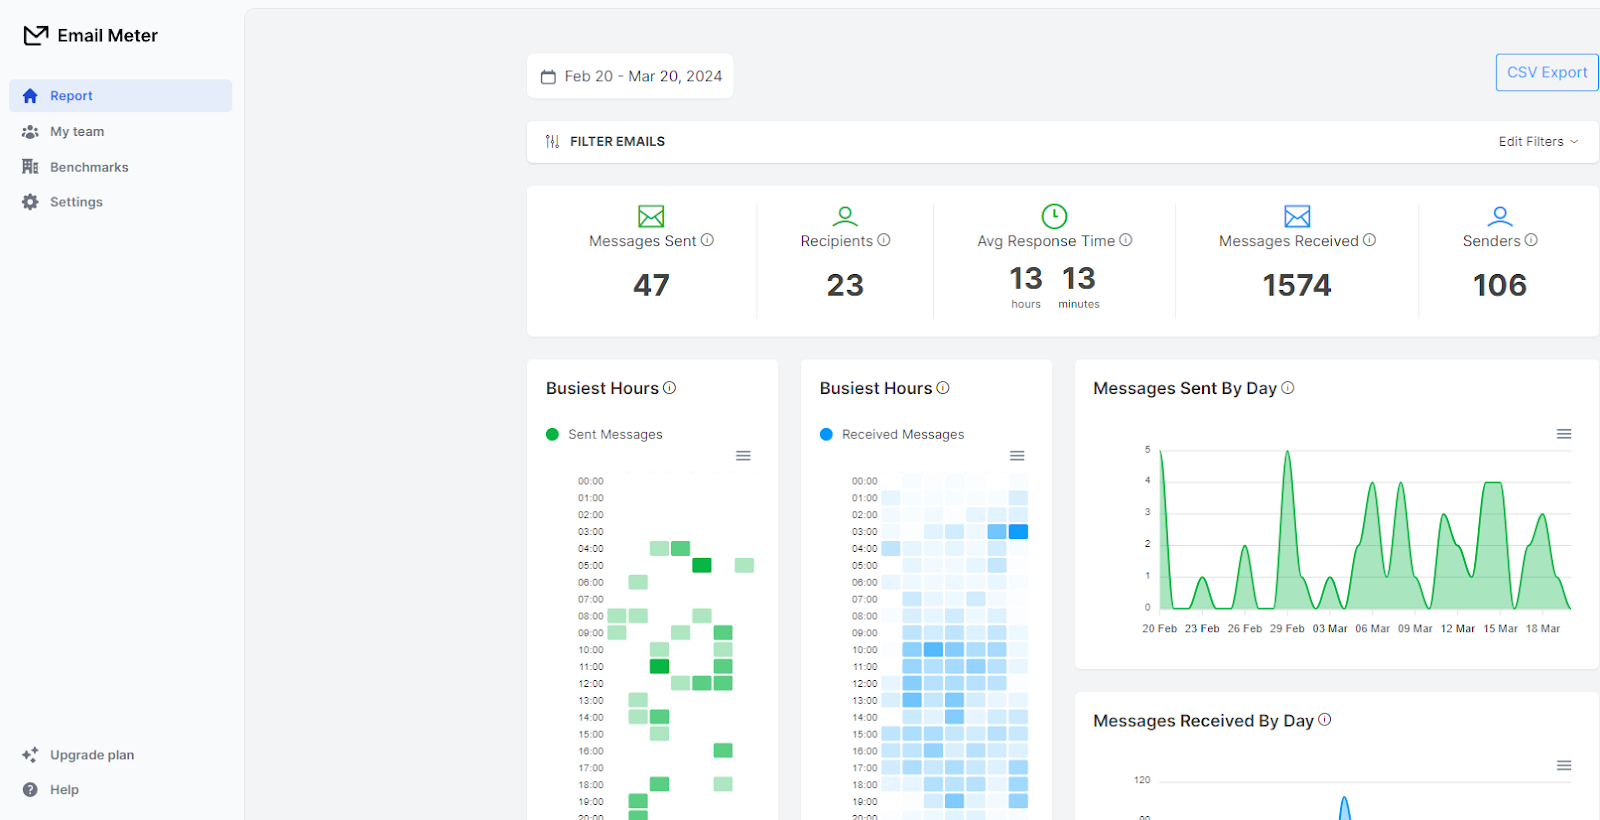
- Response time distribution: how many emails were answered in under 1 hour? Under 4 hours? Over 24 hours? The distribution tells you far more than a single number.
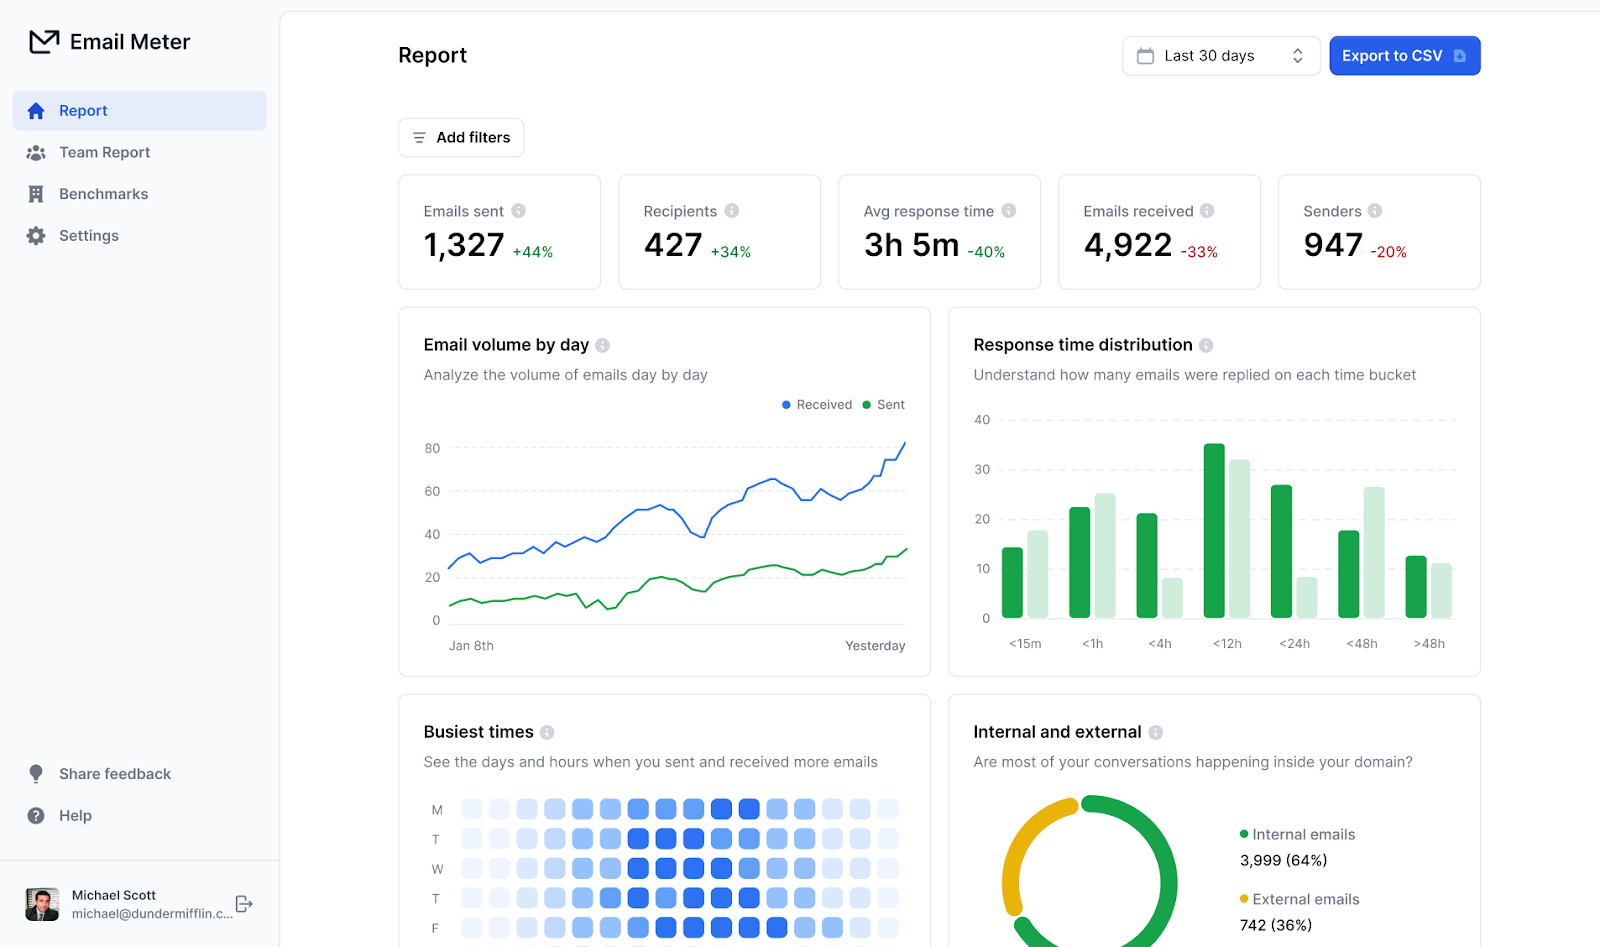
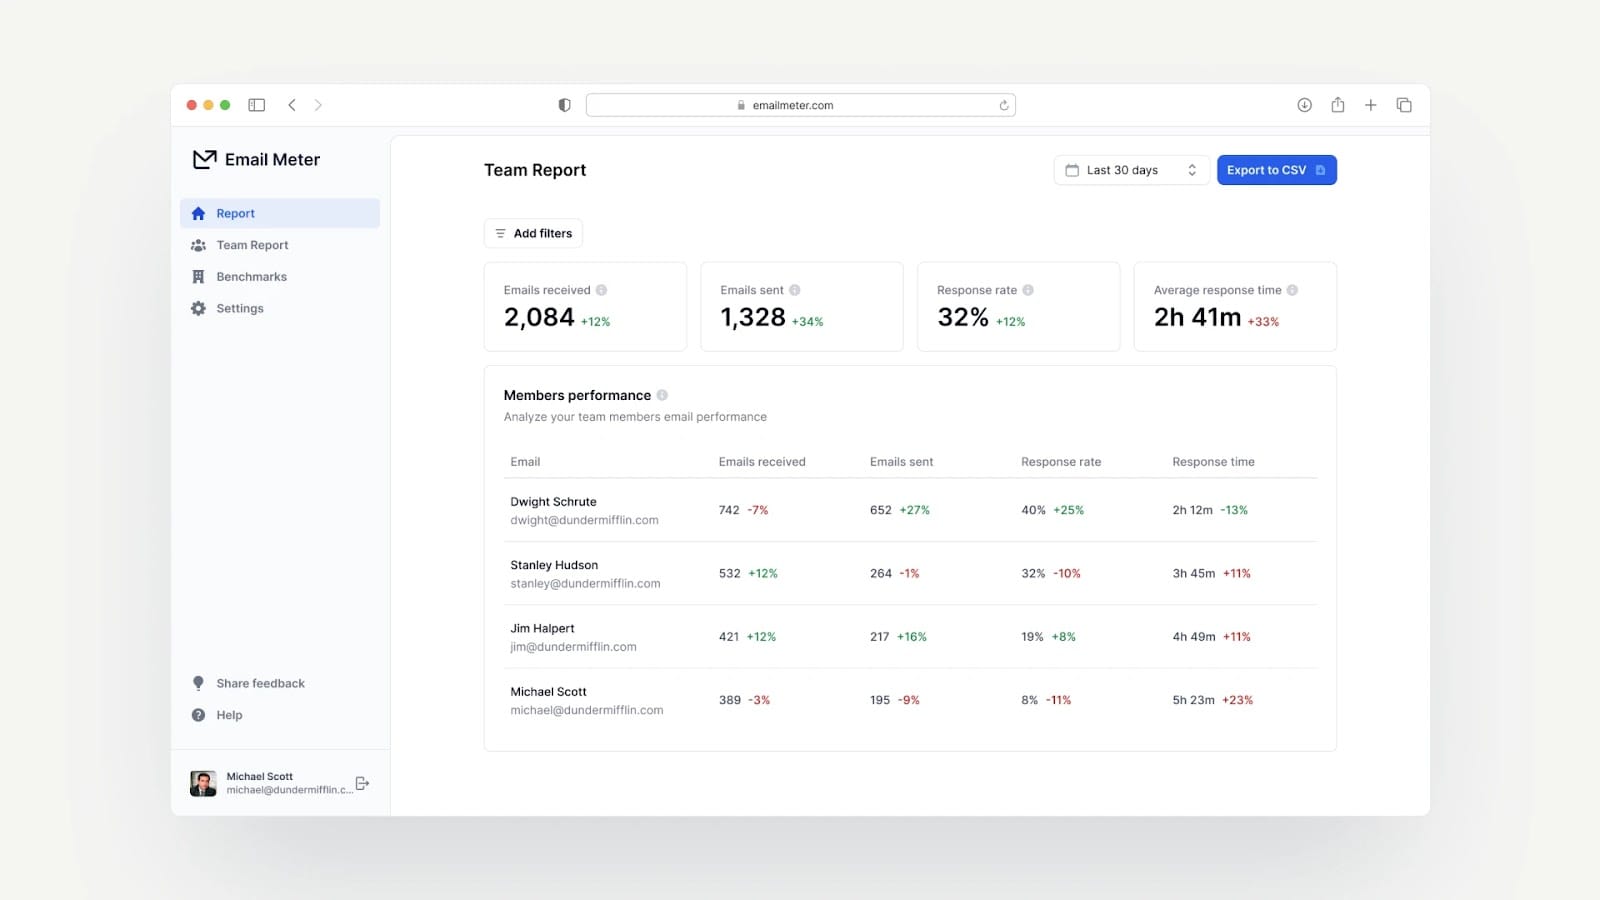
- Per-member breakdown: who is consistently fast, who is consistently slow, and who is inconsistent?
How to act on it:
If one team member's response time is significantly higher than the rest, the first question is workload: are they handling more volume? If volume is comparable, it's a coaching conversation. If they're handling significantly more volume, it's a resource allocation problem.
Step 2: Use volume data to rebalance workloads
Volume data tells you whether your team is genuinely overloaded or just feels that way, and who is carrying too much.
Volume data answers the question most managers can't: is my team actually overwhelmed, or does it just feel that way?
What to look for:
- Per-member daily volume: who is handling 30 emails a day and who is handling 120?
- Volume trends over time: is overall inbound volume growing? At what rate?
- Peak hours and days: when is the inbox busiest? Is your team staffed for those periods?
How to act on it:
If one team member is handling 3x the volume of another, that's not a performance problem, it's a distribution problem. Rebalancing workloads is often the single highest-impact change a manager can make after seeing volume data for the first time.
Peak hour data is equally actionable. If 40% of inbound emails arrive between 9am and 11am on Mondays, and your team's slowest response times are on Monday mornings, you have a staffing problem, not a performance problem. The fix is scheduling, not coaching.
Step 3: Turn SLA compliance into a weekly habit
SLA compliance connects your data to your business commitments, but only if you review it every week, not every quarter.
SLA compliance is the metric that connects your data to your actual business commitments. But it only works if you review it consistently.
The weekly review (15 minutes)
Every Monday morning, look at three numbers from the previous week:
- SLA compliance rate: are you above or below your target?
- Average response time: is it trending up or down?
- Unreplied emails: did anything fall through the cracks?
If SLA compliance dropped below your target, work backwards: which days were worst? Which team members were furthest below target? Was inbound volume unusually high?
This 15-minute review, done consistently every week, is more valuable than any monthly deep-dive analysis.
How to set realistic SLA targets
If you don't have SLA targets yet, start by establishing a baseline first. Collect two weeks of data before setting any targets. Then set a target that's achievable but stretching, typically 10-15% better than your current baseline.
Common starting targets:
- Customer support: 90% of emails replied to within 4 hours
- Sales: 80% of inbound leads replied to within 1 hour
- Internal operations: 95% of emails replied to within 24 hours
Step 4: Coach your team with data, not impressions
Coach with numbers, not impressions: replace “you have been slow” with “your median was 6h20 versus a team average of 2h45, let us look at why.”
Email analytics changes how performance conversations work. Instead of "I feel like you've been slow to respond lately", you can say "your average response time last week was 6h 20min, compared to a team average of 2h 45min, let's look at what happened."
How to make data-driven coaching work:
Share the data transparently. When team members can see their own metrics alongside the team average, they self-correct without needing a manager to intervene. Peer comparison is a powerful motivator, more effective than top-down feedback in most cases.
Focus on trends, not snapshots. A bad week happens. What you're looking for is whether performance is improving over time. A team member whose response time went from 8 hours to 5 hours to 3 hours over three months is trending in the right direction, even if they're still above the team average.
Separate volume from performance. Always check volume before concluding that slow response time is a performance issue. A team member handling 150% of average volume who has slightly slower response times may be your highest performer, not your lowest.
Celebrate improvement publicly. Share positive trends in team meetings, "our median response time improved by 22% last month." Public recognition of improvement reinforces the behavior you want to see.
Step 5: Report upward with confidence
Translate metrics into outcomes leadership cares about: customer satisfaction, reliability, and headcount planning.
Email analytics data gives you something most team managers lack: objective evidence of performance and progress.
What leadership wants to see:
Leadership doesn't want raw metrics, they want business outcomes. Translate your data into the language that resonates:
- Response time → customer satisfaction: "Our median response time dropped from 5h to 2h 30min over Q1. Faster responses correlate directly with higher customer satisfaction scores."
- SLA compliance → reliability: "We met our 4-hour SLA target 94% of the time last month, up from 71% three months ago."
- Volume trends → resource planning: "Inbound email volume has grown 35% over the past six months. At this rate, we'll need additional headcount by Q3 or response times will begin to slip."
The monthly report structure:
Keep it to one page or one slide. Three metrics, three trends, one recommendation. Anything more and the message gets lost.
- Current SLA compliance rate vs target
- Response time trend (last 3 months)
- Volume trend and projection
- One recommendation: what needs to change to maintain or improve performance
What good email analytics looks like in practice
A customer support team of 8 people handling a shared support@ mailbox on Google Workspace. They connected EmailMeter and established a baseline over two weeks.
What they found:
- Team average response time: 5h 14min
- One team member averaging 11h (handling 40% more volume than average)
- Monday mornings had 3x the unreplied emails of any other time
- SLA compliance (4-hour target): 61%
What they changed:
- Redistributed inbound volume more evenly using Gmail filters
- Added one team member to Monday morning coverage
- Set a weekly 15-minute review every Monday afternoon
Three months later:
- Average response time: 2h 48min
- SLA compliance: 89%
- No structural changes to the team, same headcount, same tools
The data didn't solve the problem. Acting on the data did. But you can't act on what you can't see.
The right tool makes this easier
EmailMeter gives you all of this data automatically, response times, volume per team member, SLA compliance, unreplied emails, for both Gmail and Outlook, including shared mailboxes.
Weekly reports are delivered to managers automatically every Monday. No login required to stay informed.
Start tracking your team's email performance for free →
FAQ
How often should I review email analytics data?
Weekly for operational decisions (response time, unreplied emails, SLA compliance). Monthly for trends and reporting upward. Daily only if you're in a high-volume environment where issues need to be caught same-day.
What should I do if response times are getting worse?
First check volume is inbound email growing? If volume is stable and response times are rising, look at per-member data to identify who is falling behind. If it's widespread, it's likely a process or prioritization issue, not individual performance.
How do I get my team to engage with email analytics data?
Share it transparently and frame it as a team metric first. "Our team average is X" before "your individual number is Y." Celebrate improvements publicly. Use the data to advocate for resources when volume is the issue, your team will trust the data more if they see it working in their favor.
Can I track email analytics without my team knowing?
Technically yes most tools connect via API silently. But transparency consistently produces better outcomes. Teams that know they're being measured, and can see their own data, improve faster than teams that are monitored covertly.
How long before I see improvement after setting up email analytics?
Most teams see measurable improvement within 4-6 weeks of consistently reviewing and sharing the data. The biggest gains usually come in the first month, after the initial rebalancing of workloads and staffing adjustments.
How can email analytics reveal team communication patterns?
Email analytics surface patterns you cannot see in the inbox: who handles the most volume, when emails pile up, which threads take the most back-and-forth, and where response times slip. Together they show how work really flows across your team.
How do you use email analytics to improve collaboration in remote teams?
For remote teams, email analytics replace presence as a performance signal. Track response times and volume per member to balance workloads fairly, spot people who are overloaded or stuck, and keep service levels consistent without micromanaging.
See how Email Meter Enterprise can elevate your email analytics. Request a demo today.