A look at what AI adds on top of your email data: sentiment, categorization, escalation detection, and dashboards that surface what matters.
What you’ll learn
- What AI can read in your email that plain dashboards miss
- How sentiment and categorization work in practice
- How to build a dashboard your team actually uses
Want a dashboard built on your own email data?
Email Meter reports response times, workload per person and SLA compliance across Gmail, Outlook and shared mailboxes, with no spreadsheet work.
Request a demo →Prefer to read first? See our guide on what to look for in an email analytics dashboard.
Transcript
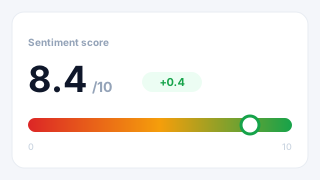
Shaun Pereira: Let me share my screen, and today I'll be walking you through the topic of building smarter dashboards with AI-powered insights. So you should be able to see my screen right now. And just basically… basically how… what this helps with, and it helps with revealing your email data, and how your team uses emails. This also helps you make better decisions. Again, depending on your use case. This could be for sentiment, and I'll be covering a few use cases based on this right now. So, the first use case… actually, it's not a use case in the sense, a travel company came to us with a problem, like, analyzing sentiment. Since it's a travel company, they were really communicative about, hey, how did the employees email the clients, or the companies, the email, and so on. So, they really wanted to focus on customer relationships. And they came to us with a problem saying that, hey, could you help us analyze sentiment? Like, could you help us to show which emails are negative, positive, or neutral? And at Emil Meter, we really ask them a few questions, like, hey, how do you define these emails? Like, how do you define positive, neutral, or negative? Since every company defines positive, negative, and neutral in a different way. Based on the information every company gives us, and what they gave us, we build them a similar page like this. So this page really helps you prevent any miscommunication before it happens with the client, and maintain consistent brand… maintain consistent brand voice. This also helps identify relationships if they are declining or getting better at a glance, and also coach themes based on real sentiment data. So on the right-hand side, on the dashboard, you can also filter by employee, if you want to see all this data by employee on your end. So, say, I just want to do it by Dwight. And this data is filtered by Dwight. So it shows me Dwight's sentiment score is 46%, and that means it's really bad, because there's a lot of negative emails, rather than positive emails. And also, on the other hand, he has a lot of neutral emails. So, for the manager, from a manager perspective, it's good for a manager to just take a deep dive in the emails. They can see the graph on email meter, and they can see where were these negative emails coming in. If your company speaks to a lot of B2B businesses or big corporations, you can also see which were those negative emails, and who… which company were they sent to. You can also filter the data by company, so if you want to just check your biggest clients, in this case, say, Amaya, I can filter by Amaya. Okay, Omaya doesn't have data, we'll just check Appro. So, for this company, specifically, we have data on this, and we… it shows you, okay, 2 emails received by this company, and the sentiment was 78.5. So the relationship with this company is really good. moving forward, allowing… we also allow managers to filter by sentiment, because not everyone loves negative sentiment. So, on our dashboard, you can just filter by negative sentiment only. And the best part about negative sentiment, you can also see the email in the mailbox, what the negative sentiment was. So this really helps managers to troubleshoot and identify issues. So, if there's a negative sentiment from umbrella company, like. this one, as you can see here, their legal department has asked for some damages. This really can allow a manager to jump in and save that relation, or see if you can amend that relationship in any way. There's a whole email list on all the custom pages of the dashboard. Moving on to the second part of the use case, which is AI categorization. So, this is where we really work close with your team and ask you for examples of how would you like to categorize emails. So, say you're a manufacturing company. In this case, on the right-hand side here, we have work order, payments, insurance, compliance, access, and ID support. All these topics are given by you, so if you're a travel company, this would be bookings, payments, tickets, and so on. So, depending on the company, we can show you what types of emails you receive. The information we need from you on this is how would you like to categorize your emails? Like, send us top 10 or top 20 topics most interesting for you. And once we have this, we train a model to show you the topics you receive in the mailbox. So if you filter for, say, a week, in that week, you can understand, okay, in this week, I received a lot of work order emails. In the next week, I receive a lot of payment emails. So this really helps you identify trends in your business, and how your business is functioning on that point of view. Moving on to the other use case, which is Escalation Center. And Escalation Center is mainly for identifying emails that have been escalated to the management, or have been escalated to the employee. So, look at this from a perspective, like, say you have 100 employees, and all these 100 employees receive a few emails, but you don't know which of those emails really need an escalation. What we can do at Email Meter, depending on how you'd like to track KPIs, we can ask you a few questions, like, hey, what emails do you consider escalation? Are they auto-renewal emails, are they payment emails, or subscription errors? So this is where we train the model, and once we receive these emails from the database, like, for the mailboxes we're tracking. we can automatically flag these emails on the Email Meter dashboard. So on the right-hand side, as you can see, this is a quick image of how we can show the data, so we can show you all the new conversations we've analyzed, so 431 new conversation in this case. And also show you the potential escalations. So, the potential escalations here are 5, based on the data we already checked. And once you have an idea of these 5 potential escalations, as a top management of the company, or as a manager, you can just go in and see, okay, what are these escalations? Which company did they come from? And this really gives you an overview to just jump in and save that relationship before that relationship turns from good to bad, I would say. We also have another use case, actually, this is really interesting. So, this is related to the travel company, again, of transforming robotic emails into human connection. And the main use case about this one is the travel company, they really wanted to save customer relationships. So, when they wanted to save customer relationships, they always focused on being, like, really friendly to their customers' emails, like. being, like, if you receive an email, hey, could you book this for me? They wanted the employees, actually, to reply, saying, yes, I can absolutely book this for you, these are the details, what… would you like me to book this, or send you an itinerary of it? So that's, in the sense, they want to be really friendly with their customers and so on, and what they wanted us to build for them is they just want to analyze how many emails have been sent. How many of those emails have been provided an excellent service? How many of them have been passive-aggressive? And how many of those have been robotic cold? The main reason why they wanted to identify robotic cold emails is because they got a lot of complaints from companies saying that your employees are not replying with all the information we have asked for, and that's how they wanted to identify, okay, which of these employees are not replying, and what are these emails, basically? So this is where we built them a custom page to prevent the miscommunication they have. This also acts like a page for managers to train employees based on the way the company communicates with their clients. And this also helps identify relationships, so if it's going bad with an employee, so if an employee's sending a lot of robotic call emails, that means the employee needs to be trained a little more. And in the end, this also helps build customer… stronger customer relationships. Moving on to the next use case we have is actually identifying clients that require immediate attention. So, this is more about the database and the CRM also use, with a hint of AI on it, and it really depends on your use case. This is an internal use case what we have. So, internally, we use this, like, number of clients, these are just examples, but say number of clients, 141. If we do not contact a client within 60 to 90 days, we want this dashboard to flag it and show it to us. So, as you can see here, 24 clients within 60 to 90 days without contact. And if the clients have been Above 90 days without contact, we wanted to flag and show as critical high-risk clients. So on the email meter dashboard, we can show you, okay, how many clients have been contacted within 0 to 59 days, on the other hand, from 60 to 90 days, and how many clients have not been contacted for 90 plus days. This gives customer success executives an overview of, okay, we need to contact these clients, or the management an overview, oh, like, these clients need to be contacted. You can also filter by account value, so say the highest ticket clients, like 200K plus, you can just filter by this and check when was the last day since we contacted those clients. So, from a sales perspective, customer perspective, and a management perspective, anyone can really jump in the dashboard and look at this data, and if the relationship is going bad, or if they haven't been emailed, anyone can just email them at that given point of time. We also have the other filter, which is industry on this, so if your company deals with food and beverages, or healthcare, or manufacturing, you can also filter this company-specific, so say food and beverage. Well, we don't have data on that one, but let's see if we have demo data on retail. Okay, if you see on retail, we have Walmart, so we show you, okay, this account is 200K plus, and the last day since this account was contacted was 234 days. So, this would give the customer success manager an overview of Walmart that, hey, I need to reach out to this client to save this relationship. So, moreover, this really helps maintaining constant touch with your clients if your product is highly customizable, and to see what's there, and also identifying clients at high risk before they churn. Coming to the next use case, so getting visibility into your team's communication. So, at Email Meter, we give you a granular approach. If you want to take a deep dive into the employee's workload, you can completely do that. We also have this part, which you can take a deep dive into the subject line of the email, and understand what's really happening on that end. So, some companies usually want a high-level overview of what's happening. Some managers really want to see… go in the email and see, okay, what was this email? Why was it negative? What really happened? Could we improve something on that end? So, this page specifically gives you an overview of what's happening. So, we show you the company the email has come from, the type of request it was, so… codes take too long, or need inventory in Miami, depending on your business, we will show you, the data from your business on the mailboxes being tracked. And we show you when was the first time they emailed you. Moreover, what managers want to track, if an email is in the mailbox, when was the last time my employee replied to it, or the customer replied? So we show you that as the latest request, as 2 days, 1 days, or 3 days. So this shows you a last touchpoint from the customer perspective. or the company perspective. In this case, we already do… we always do the employee perspective, because we need to follow up with the, businesses to check if there's an update on the end. And over that, we also have the inside part. So the inside part, we show you a quick summary of the email. The main reason why we show you a quick summary of the email, because we cannot store your email data, as that is your data, so we process this, and we're allowed to show you a quick summary of your email. And on the other hand, we have the sentiment. So, negative, positive, and neutral. This is, again, how you define positive, negative, and neutral on your company, as every company defines positive, negative, and neutral in a different way. Moving on to one of the last use cases we have on this page is you can see where your team efforts are going. So, say you have 20 employees, or 100 employees. As a management perspective, you don't have an overview of what's really happening, like, where is employee A working? Are they focusing on clients? Are they focusing on prospects? Are they focusing on past clients? What's really happening? So, depending on the data we get from your CRM combined with AI, we can show you where your clients really focus. So, take John, for example. I can filter for other employees, but take John, for example, in this case. We can see he sent 250… 2,579 emails. 40 unique companies contacted, and his main focus is clients. Probably this employee is on the customer success side. So let's filter for another employee. Take David Brown. And as you see for David Brown, he has sent 1,474 emails, the unique companies he's contacted is 44, and the primary focus is prospect. At Email Meter, we also show you a breakdown of how many contacts they're contacting, and a breakdown of the distribution. So if you hover on it, you get, like, prospects, then there's clients, 189, and there's partners. So this really helps you gauge an understanding, okay, where each employee's time is going, and helps you optimize focus based on the role, and what the team is doing in that point of time. Comes to the end of my presentation. I'm open to any questions. In the chat?
Mélanie Lelait - Email Meter: Thanks, thanks a lot, John, for the presentation. I just wanted to remember everyone that, you can use the chat, the Q&A feature, or raise your hand on a mute so you can speak, so to ask your question. And, so a question just came in the chat, so it's from Irina. I have a 27 product. Can email collect feedback about this 27 product via emails?
Shaun Pereira: That's a really good question, you know, and thanks, Melanie, for putting the question out here. So, yes, email me that can provide you feedback about these 27 products. What we need from you is just, like, a list of all these 27 products, and how we can identify these. From the email, we would extract feedback about this, and depends on how you would like to see it, like, would you like to see it per product, or a collective overview, or just how is the product? Is the feedback going positive, negative, or neutral? We can show you… we can build you a custom page based on how you'd like to see all this data.
Mélanie Lelait - Email Meter: Perfect. There's, one more, so how long does it take to build an AI dashboard?
Shaun Pereira: That's another great question. It really depends on your use case. Once we have all the information from you, you can say between 2 to 4 weeks on that end, but once we have all the information, it should be pretty quick.
Mélanie Lelait - Email Meter: Perfect. I don't know if there are some more questions? Yes, and what information do you need from me to build this dashboard?
Shaun Pereira: That's a good question also. So, this really depends on your use case. Since everyone's use case is custom, this really depends on everyone's use case. If you have a manufacturing use case. We would need what the topics you would like to categorize for manufacturing on that end. If you have a food and beverage use case, we would just need the products you have in your food and beverage line, and we can start building the dashboard. But it's basically, to give you an overview, it would be for sentiment analysis, take, for example, would be 5 example… 5 emails which you think are positive sentiment, 5 emails which you think are negative sentiment, and 5 emails which you think are neutral sentiment. And once we have all this information, we can start building your custom dashboard.
Mélanie Lelait - Email Meter: Perfect, that's lovely. I don't know if there are any questions, so for the moment, there's none, so if that's okay, we will bring today's session to a close, so thank you, everyone, for joining, for taking the time to be with us. And of course, thank you to Sean for sharing all this insight with us. So, if you have any question and want to chat a bit more, so we will stay a bit on the call, so don't hesitate to stay here, and if you prefer, you can reach out as well to Sean directly per email. So, we will add his contact details directly in the chat. Thank you, everyone. Have a wonderful day, and I hope to see you soon. Bye-bye!