Six visibility gaps most customer-facing teams have in their email, and how to close them before they cost you.
What you’ll learn
- The blind spots most teams do not know they have
- How to see workload, response times and SLAs in one place
- Where to step in before small delays become big problems
Ready to measure your team's email workflow?
Email Meter connects to Google Workspace or Microsoft 365 in minutes and reports on response times, volumes and workload from your existing email history.
Request a demo →Prefer to read first? See our guide on the complete guide to email analytics for teams.
Transcript
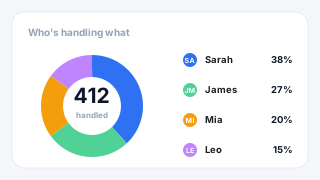
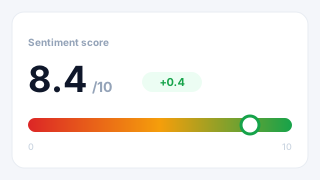
Laurence Edwards: So here at Email Meter, what we do is we build custom analytics dashboards for your email. So what that means is that you can get an understanding of various different parts of your email performance, but the benefit of that with us is that we build these dashboards specifically for you. So it means that you can have all of the analytics you need, you know, created exactly for your workflows to display the things that you're interested in, but without having to change the way that you work. So, you know, you don't have to route your email through Emailmeter per se, it's just a separate page where you can get all of the information that you need without having to completely uproot your team and change the way that they work. Now, an example of a client that we've done this for is a company that, if you're based in the US, you might be familiar with, and that's Avery Dennison. Now, they came to us basically with pretty general needs, saying that they felt that they were neglecting customers because, you know, they didn't have a handle on how busy they were. They didn't have a handle on, you know, how well people responded to customers, but also understanding, you know, who in the team might be the weaker points, you know, who needs training. Things like that. But also, they felt that what they don't know, they don't know. So, they wanted insights into how busy the team was, you know, how well they were responding to things, but also just to investigate, you know, what their workflows look like, how well they respond to people, and other bits of, you know, their email performance. And within a few months of working with us, they had managed to get their response time down to clients by 5.5%. They had also got their customer wait time down by about 8%, so that basically means, you know, response time overall, as opposed to just within business hours. And then also, they'd managed to reduce their thread length with clients by 8 and a bit percent. So basically, the amount of back and forth that was going on in conversations, they managed to bring that down, so they were responding to clients and answering things, you know, in less emails. So yeah, you know, a display of when implementing a tool like Emailmator, how you can quickly get results, and about how the client, you know, feels those results. So, what I'm gonna do is I'm gonna share my screen, and I'm gonna run through a few things that we do at EmileMeter, and give you some use cases. So, this is an example of one of our analytics dashboards. Now, as I said, it's a, you know, a completely customized tool, it's something that we build for you. So these pages are just, you know, to give you a bit of inspiration, to show what we've done for people in the past. But, you know, we customize these pages for you, we can build new pages based on the use case that you have. So yeah, just bear that in mind when we're running through the dashboard. Now, this page that we're looking at here is the team view page. Now. This page is, you know, if you have… maybe a client might come to us and say, okay, I want to know who within my team is the busiest. I've got everyone working remotely, I want to know how much work people are getting in terms of received emails. how many emails each person, you know, is sending, and I want to compare overall metrics and just see who's busy, who isn't, you know, things like this. this is the page for that, a really generic page. So what it allows you to do is select specific date ranges. You can see at the top here, we're looking at April of 2023, but I can look at individual days, weeks, months. I can even look at, you know, historic data. You get 2 years of historic data from the date that you sign up to email meter, so I can go back and see how things have changed before I was using the tool. I can then select the types of emails that I want to consider for this page. You know, maybe I'm only interested in a specific department. maybe I'm only interested in, you know, a specific type of email, you know, direct messages, or internal emails, or not automated emails, stuff like that, even down to looking at communication with specific clients, or groups of clients. So, we first set those up. And when we've got those ready, then we've got an ordered list of all these different metrics side by side. So let's say I want to see how many emails each person has sent versus, you know, versus each other. Then I can easily list, most to least. maybe I'm interested in response time, and I want to see who's the quickest versus the slowest, then, you know, I have those ordered here. So yeah, a really easy way to get insight into some of the more generic metrics. that we offer. Now. Another really common use case for us is people saying, okay, my customer success team is expected to respond to clients within, you know, 8 hours or 12 hours. And because of the fact that we've not been meeting this goal, we've had clients leave, which, you know, is affecting our revenue. It's… although it seems like a pretty easy thing to, you know, to see if… If you're getting right or wrong. it's hard to get an overall view for the, you know, for the team and spot problem areas. So, for that reason, we designed the SLA performance page. Now, just a really easy visual way to see who's responding well, who isn't, and you know, if we're missing things, then what they are, and who's being affected. So… You first would set the goals at the top here. For, you know, for this example, we have set up to 12 hours, between 12 and 24 hours, and beyond 24 hours, but yeah, you set these goals, it's completely up to you. Now, once we've set those, then each team member, or department, or overall, you know, however you want to define it, we can just hover over and see emails that we responded to within the goal. How many emails we missed. Like here, for example, I see that Dwight, missed 4 emails in the date range that we've selected, so I can select that. Go down. And I can see all of the raw data for these emails, so I can see when the email came in. Who it came from. What the subject line was, and how long it took to, you know, to get a response to this email. So, if we are missing things, it's a really easy way to see who's doing well, you know, who's neglecting clients, and, you know, which clients are suffering this. So, a way to register who's being affected before it translates to, you know, them leaving and you losing revenue. Yeah. Now, we also have a way to set alerts for these response times, too. So you've got that kind of retroactive data, but if I want to get a nudge when I'm about to miss a goal from a client, then we can set that up for you as well. So, we've got the alerts list here, and what this allows us to do is basically build an alert with loads of different, Basically, you can control every different part of the alert, so I can control who it applies to within my team by selecting here, let's say for Michael. I then apply who I want it to, you know, consider in terms of our clients, so let's say I want it to be this client. And this client. Then I set the timeframe, so I could say, okay, 8 hours. And then who I want it to go to. So, you can layer these alerts, and, you know, define who you want them to go to. Let's say, maybe, for the first alert, for 8 hours, I want it to go to… Me. So I can set that. What I can also do, then, is I can layer them. So let's say the first alert should go to the, you know, the team member responsible for the account. I could then set another alert, you know, for 12 hours, or 16 hours, that goes to the manager above me, so I know that if I miss things, then I'm going to be reminded. However, if I miss things by a really long time frame, you know, especially if it's important clients, then I can have somebody more senior nudged, for example. This is a way in which you could use these alerts, but… Again, completely customizable, you can layer them as you want, but the idea being that you're getting a reminder if you're missing things. Now, another really common use case, when it comes to email meter is getting control of your shared inboxes, or delegated inboxes, if you're using Gmail. So, for example, maybe you've got, you know, a sales inbox. you've got multiple people using it. Now, you don't want to have to train all of your team, you know, how to use a ticketing system, or some kind of system where, you know, workload's being distributed, because obviously it's, you know, it's gonna disrupt service within these inboxes. You, you know, you like the way you have things now, but you need to know who's doing what. You know, how busy each people are, you know, each person is within the inbox. Now, we have a page that looks like this. This is one of our more, you know, our more basic looking. shared inbox pages. So… What it allows us to do is have a list of all of the generic addresses that we have. I can select an address. I can then go down and have a list of all of the people that have accessed the address. Let me actually select this with a bit more data. I can then have a list of all of the people that have accessed the address, what percentage of workload each person is handling. And then how many emails that translates to. So, it's just an easy way to find out, basically, if everyone's pulling their weight in the same way in the inbox. And, as always, how long people are taking to respond to things. So if I can see that one person is only doing 10% of the work, and they're taking longer to do it, then, you know, there's a conversation to be had there. Yeah. Now, there are pages with a bit more detail when it comes to shared inboxes. You know, for the pages that we looked at before, those SLA pages, we can distribute them, you know, to be shared inbox agents. Let's say you just want to monitor a few shared inboxes. and you have response time goals for them, and you want to see agent by agent, you know, the response time goals, we can do that for you. As I said, everything's customizable. But yeah, this is just one of our more… More basic-looking shared inbox pages to understand workload and response times. No. The next page that I wanted to show you is a page like this. Now. This page right now is displaying unreplied emails. But, there's many ways in which this page can be used. So, a common way is, let's say, everything that comes into my inbox, you know, I want something done with it. Maybe it's a response, maybe it's the… if it's, you know, doesn't need a response, that I want it archived, or maybe I want it to be forwarded. Or vice versa. But I want to make sure that something is done with, you know, everything on this page. So, we have… basically got this page, which will show for you all of the actions that you've defined. So, let's say if I want to make sure that everything is either archived, forwarded, or replied to, then I can set those actions, and then I can see, for the entire team. if all of the emails that they received got one of those actions applied to it. So basically, the idea here being… if we're leaving things sat around in this inbox for a long time, then it's really easy to spot. I can see who within my team is kind of drowning in work. how long the things have been there for, as well. You know, maybe I've got lots of, you know, unactioned emails, but they've only been there for a day, that's a sign that, you know, I've got too much work, you know, at my desk. But if I've got too many emails, and they've been there for 10 days, 15 days, then it's a sign that, you know, again, that I'm overloaded, but maybe, you know, because I'm just not doing my work. So, you've got the ability to view that. But also. the ability to look at the raw data for these emails as well. So, if I do have a load of stuff in my inbox. I can hop in and see what it is. You know, I can see where it came from, what the subject line was, how long it's been there for, vice versa. And again, as I said, you can define the actions that we're considering for this page. You know, based on what's important to you. So we could have a different category for, you know, things that were actioned, things that were archived, things that have been opened but not archived. It's really up to you, it's just, yeah, whatever's important to you. Yeah. And something to mention. for these pages as well, is, you know, obviously you've got the option to log into the dashboard, whenever you want. However, if you would prefer to have these things being automated to you, you know, if you know that on 9am on Monday mornings, you've got an important sales meeting and you want to see the performance of each sales rep, we can automate all of these reports with any filter set up that you need. So yeah, you don't have to, you know, spend time logging into the dashboard, but you can get an easy view of things, you know, basically arriving when you need them. Yeah. And the final thing that I wanted to show you is something that more and more people are asking for these days. It is what capabilities we have surrounding AI. Now. for most of the pages that we just looked at, we're only considering the metadata of the email. So, if you're happy to stick with that, then absolutely you can. It just means we're not processing the body of the email or any attachments. Yeah. Now, with this page. The idea behind, you know, the sentiment analysis or, you know, body processing pages, if you will, is that we train an AI model to give you insights that you need, depending on what you want. So, one of the most common use cases we have for this is someone comes to us and they say. you know, I have people leaving because they're not satisfied with, you know, the emails that, you know. clearly they're not satisfied with the service, but it's really hard to know, you know, who's unhappy, who is happy, with such high email traffic that it's easier for things to just get lost in, you know, in our inbox. So, the idea behind a page like this is that you have a really easy view to show who's happy, who isn't, you know, if the trends over time are good, bad. So I can see if I go down here… We've got a breakdown of all of the clients that we're working with, the email volume that we have for each client, you know, overall, what the sentiment score is for this client. So we would train the machine learning model to understand, you know, this is what a good email looks like, this is what a kind of a neutral email looks like, this is what a, you know, a happy email looks like, or, you know, a satisfied email. And then I can really easily see, of my clients. Who's happy? Who isn't? I can easily order them, so I know who to be concerned about. Also, another common use case that's pretty similar is people wanting to know the types of queries that they are good at handling and bad at handling. So I know where to train team members on if, you know, if they've got weaker points. So again. I can filter that, a positive to negative, and I can click into any of these. So, if I know that I'm not great at quality and complaints, I've got 24 emails here, and the majority of them are negative, then I've got all of the raw data here. Broken down by sentiment. So I can easily find these negative emails. Let's say I just want to look at negative emails. I can click in here, I can see, you know, who the email came from. I can see when it happened, and then I can also see a summary, basically breaking down. So I can see for this email that Umbrella Corp legal department formally notified about a contract breach because of quality issues. Now, an email like this is obviously really important that we have in our attention. if we're getting lots of emails like this, you know, if we're about a particular topic, then it's easy for one of these to get lost, but it doesn't make it less important. So, having a page like this, where everything can be filtered in one place, is really important, and could, yeah, save your skin when it comes to, you know, customer churn. So, yeah, this is something that's more and more popular with us these days, but there's a whole host of things that can be done when it comes to body processing. It's just a case of you explaining to us what you want to do, us kind of building the idea for a page that you might like, and then once you're happy with that, you know, we'd go back and forth talking and tweak the page. And once you're happy, then, you know, we would build it for you and train the machine learning model. Yeah. Now, that is the majority of the dashboard features I wanted to run you through today. But before we wrap up, were there any questions that anyone had that we can answer?
Mélanie Lelait - Email Meter: Yes, thank you, Lawrence. You're right, so there are some questions in the Q&A, so I will start with the first one. Does email meter work if we use another CRM, for example, Salesforce?
Laurence Edwards: Yeah, good question. So, two parts to that. The first, as long as everything's still running through your email account, like, or your, you know, through Outlook or Gmail, then yes, absolutely. And another thing to mention is that all of the data that we have in this dashboard, we could actually enrich with other data points that you have, you know, data sources. So let's say… you are using HubSpot. But it doesn't really give you the analytics you need. So you could also use Emil Meter, but we could take all of the data that you have stored in HubSpot and use it to enrich your data with EmileMeter. So you already have all of your client lists, you know, information that you've built up, you know, in HubSpot, your source of truth. And via API, we could connect the two, so that you have that extra data in an email meter. So basically, yes and yes to that.
Mélanie Lelait - Email Meter: Perfect, thanks a lot. Second question, why is it important to monitor how my team engage with our customers?
Laurence Edwards: Yeah, for sure. I mean, really, just when it comes to customers being happy, and how long they stay with you. I mean, this is one of the main things that we see at EmileMeter. Is the fact that, you know, unhappy… unhappy customers leaving is, you know, there's a real drain on revenue, and it's really hard to get the insight to know who's happy, who isn't, who's being neglected, until they actually leave. So, I mean, having the insight before it affects revenue is really important, and yeah, it's one of the most common use cases we see here at EmileMeter. Yeah, having all of that information in one place.
Mélanie Lelait - Email Meter: Got it, perfect. And, maybe the last question, if we sign up for AI feature, would they work exactly the same?
Laurence Edwards: No, absolutely not. So the AI part is built, you know, basically from nothing, specifically for what you're looking to do. So, I mean. If you don't have a clear idea of that, you know, we've worked with loads of different clients on building these features, so… you know, we can run through the types of things that we've done for other people to give you a bit of inspiration, but at the end of the day, it's really what you need. But also, these kinds of things aren't set in stone. Like, we consider ourselves a productized consultancy, so… We maybe, we build a dashboard for you at the beginning, and as you get more data, more information, and understand the way that you're working more, then, you know, you decide, okay, this is more important to me. this is a page I would like added. You know, we're changing the tool as we learn more about the way that you work, and as you learn more too. So, yeah, not only would we build the AI features for you, but every part of the dashboard, you know, we can change over time to suit the way that your work is changing, and, you know, what you decide you need after you've had the information that Email Meter provides for you.
Mélanie Lelait - Email Meter: All here. Thank you, thank you so much, Lawrence. So if there are no more questions, we will close today's session, so thank you all for joining us, and of course, thank you, Lawrence, for sharing all this insight and for answering all the questions. Remember, this is part of a weekly webinar series designed to help you improve your email workflow, so we'd love to see you next time. And if you'd like to, connect or, exchange a bit more of what we, covered today, you can contact us directly, reach out to Lawrence, so we have added his email address directly in the chat. And yeah, thank you so much, and have a nice day. Bye-bye!
Laurence Edwards: Thanks, everyone. Bye-bye.