Your email data is far more useful when it sits next to the rest of your business data. See how to push it into BigQuery and beyond.
What you’ll learn
- How to get your email data into BigQuery and your warehouse
- What you can do once it sits next to your CRM data
- Real examples of email data driving business decisions
Want your email data in your own warehouse?
Email Meter connects to BigQuery and any visualization tool, so your email metrics sit alongside the rest of your business data.
Request a demo →Prefer to read first? See our guide on how BigQuery fills the gaps in your email data.
Transcript
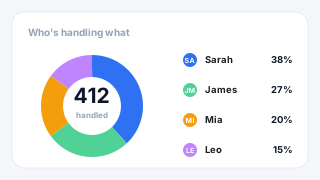
Laurence Edwards - Email Meter: Now, unlike a CRM, or other systems where you need to kind of change the way that you work and start sending emails directly from the platform, which can be an inconvenience and requires, you know, some training, and most likely you'll have some customers affected by that kind of low point in a, you know, in email usage. What we do is build around the way that you work currently, so that, you know, you can get the insights that you need without having it affect your team and the way that you work. Now, today's focus, especially, will be on getting your data directly from us, as opposed to us building a customizable dashboard for you, which is what we primarily do. What we also do, another product route we have, is giving you an access to your data in BigQuery, which is the data warehouse that we use. This is really straightforward, it's just a case of us giving you this data, and what it allows you to do is integrate the data that we provide in with any other platforms you're using, any other dashboards you're using internally. So, if you want to have everything in one place, you know, but you still want a way to get that access to that data, we can provide that for you. And that's some of the things that we can run through today, and we can run through a few of the different ways in which you can use that data. So what I'm gonna do is share my screen, and I will run you through. Some of the examples of things we've done with clients in the past for this. So… One of the first use cases that we have for a plan like this is a pretty standard one of not knowing what the workload distribution looks like within your team. So, if you get a load of emails from clients, and you have team members complaining that, you know, I feel that I'm overworked, I feel like I'm kind of taking the brunt. of these projects, but it's a pretty hard thing to understand, especially in larger organizations, where you've got loads of people, you know, receiving loads of traffic. It's a hard thing to keep a lid on. So… A really basic page like this that tells you, you know, for a specific date range, how many emails is each team member receiving and sending, is really good. At the top here, we have a list of load of different filters, which allow you to, you know, first select the date range, so I give you… you know, you've got the option to look at days, weeks, months, and we also give you access to two years of historic data as well. So that means that from the point that you begin using email meter, you can go back and look 2 years before, as long as there's been, you know, email data in the account up until that point. And it just means you can see how things have changed before you started using the tool. We can filter for any of these, like, order them, so… If I want to look at who's sending the most emails, I can have them ordered most to least, or received most to least, etc. And then also on the right, you have access to the response times of all of these accounts. Now, this is the median response time, the most common, so kind of like the average, but with, you know, any outliers. Removed to give you, you know, a more fair understanding of… of how this person typically responds. Yeah, so you can order them as well, you know, slowest to quickest. And then the response rate is basically just of the amount of emails that you received, how many of those did you reply to? And those are the ones that we're considering for the response time. So, you know, if you're thinking, oh, you know, I get some emails that don't need a response, and I don't need that to affect, you know, I don't want that to affect my response time. Then don't worry, we're only considering the response times to emails that you actually got back to. Yeah, and that's what the percentage on the right represents as well. We can also get rid of any emails that don't, you know, we don't find interesting in these figures. Let's say I only want to see client emails. There's a few ways we could do that. We could get rid of internal emails. We could get rid of… Automated emails. You even have the ability to look at emails from specific domains and addresses. So I could, you know, look at specific groups of domains, and you can even save those in the settings here. by building contact groups and defining the list of clients you're working with. So if I want to see how much time I'm spending on a specific group of clients, you know, make sure the workload distribution between clients is fair, then you've got the ability to build those contact groups, save them. And then filter for them on the dashboard. So yeah, all of this kind of stuff just to make your life a little bit easier, and less, you know, less labor-intensive when using the dashboard. No. Another really common view that people, you know, build when they are working With our data, is a view that will focus on response times, primarily. So, it's really common that people want to adhere to some kind of goal, you know, whether or not it's a goal they have with a client, you know, maybe it's a goal they just have internally, and they expect their team members to respond within 24 hours, or within 12 hours. But, again, really hard thing to know whether it's been completed. Doing it manually is really labor-intensive, and, you know, it wastes the time of people that… that have to do it. We have pages, you know, you can build yourself a page that looks like this. what this page is displaying is basically allowing you to have a goal of up to, you know, 12 hours or so, or 24 hours, and just see how well each team member is completing this goal. So I can really easily hover over a team member, see how many emails they responded to within the goal. How many they responded to outside of the goal. And then click in. and see, you know, of the ones we missed, what were they? So, this is all of the raw data that we're considering for these emails. So I can understand, you know, when these emails are coming in, who they're coming from. what the subject line was as well, so I can understand, you know, more or less what the question was about, you know, what the thread was related to. And then… how long it took to get a response eventually. So yeah, really easy way to understand within my team, you know, where there might be problem areas, but also who's being affected on the client side. So we're aware of clients that might be affected by poor response times before it translates to them, you know, churning. And costing us revenue. So yeah. Pages like this. Very useful. Nope. Another really common blind spot for people, which can be solved by the data that we give to you. Is not understanding how people are using your shared or delegated inboxes. Now, really common use case for people that we work with is coming to us and wanting to understand, you know, let's say I've got 3 or 4 generic addresses for sales, customer service, HR, whatever it might be, but I want to get the, you know, the insights I need without having to start using, you know. FreshDesk, or a ticketing system, or something where I need to run all my emails through it, you know, it disrupts the workflow that we have currently. I just want to know, you know, who's doing what, and make sure that everything's running as it should be. This is one of the layers of data that will be included in the data that we give to you. And it gives you the option to build views that let you know who's doing what in your shared inboxes. So, at the most basic level. pages like this, where, you know, I've got a list of the inboxes at the top. A list of who's done what inside of those inboxes, you know, how many emails each person sent, the percentage of workload that each person's handled. And then, of course, you know, the response times, as we looked at on the last pages. And then also the ability to flick through and look at specific inboxes. So if I want to know who is doing what in the sales department, then it's just a click away, and I can find out, you know, if the workload is distributed fairly, and if not, then, you know, I can act on that. So yeah, the shared inbox page is really useful. And this is kind of the more basic view of a shared inbox page, but… You know, you've got the option to build more, you know, more developed views with this shared inbox data. like, this is an example of an agent scorecard page that we've built out with, you know, with the shared inbox data. And what it allows you to do, basically, is just select a specific agent. And then, you know, have a breakdown of how they are performing through various aspects of the shared inbox. So if I want to know how many emails they reply to across a time frame, make sure it's consistent, you know, make sure that they're, you know, doing as they should be throughout a certain time period, then I can. We can also understand, you know, how many emails they're taking to solve a thread. So, you know, I can compare team members and say, okay, this team member typically solves things within 3 emails, whereas this person within 9, you know, maybe there's a bit of training to be done there. You know, a hard thing to understand if you don't have access to this data, but yeah, really useful if you want to know how effective people are. Inside of these generic addresses. And then, of course, breaking down response time data for, you know, agents within the shared inbox. So if I want to set, you know, different goals, and see how well specific agents are doing, then… then I can do that. And then, of course, all of the raw data that we're considering when it comes to these… these shared inboxes. Now, another really common use case When it comes… to people we work with, with the BigQuery direct connector, is… clients wanting to, you know, wanting to know that the emails that come into their inboxes are having the correct action done to them. Now. This page is an example of That action being replies, so making sure that of the emails that come into the inbox. Every email is getting a reply, or getting read. So you can see here, if we go down, it's telling me Per day, how many emails we received, how many of those got, you know, didn't get a reply, and how many of those didn't get read. And we've also got that agent by agent as well, or mailbox by mailbox. Really, the idea here is to, you know, to see the state of everyone's inbox and see who is overloaded, who has loads of things sat around that haven't been actioned properly, and stuff like that. However, you know, all of these views can be built up by you, and the action is up to you. You know, the way you want to use the data on this page is completely up to you, so… really often, we have clients working with us who understand that, you know, you don't need to reply to every email. So this metric maybe is not the most useful thing, but… Obviously, you don't want loads of emails sat around in people's inbox, clogging them up, so maybe you just want something done with the email, whether it be forwarded, or archived, or labeled, or replied to. you can really easily build out these views and just make sure that if I expect my team to do this, are they doing it? And if not, then you've got a really easy way to see, you know, who is doing this, and who isn't doing this. Yeah, and just one final… view that I'm going to… going to show to you is, you know, again, something really common when it comes to people using our tool. Obviously, it's pretty common that people are using it in customer-facing roles, and lots of people want to separate those views out. So I have a specific view, maybe for my highest-paying clients. or clients that I want to pay special attention to, for whatever reason. Nough. This can be really useful, because it just gives me a breakdown of how I'm performing with this set of clients, and… If I look at the list here, it's giving me a view of, for each of these clients, what am I doing with them? You know, how busy am I with these clients? How well am I responding to these specific clients? You know, the ability to set different goals for just these clients, and then see how often I've breached these goals. You know, it's great having a page that shows all the of your team's performance, you know, with every client, but obviously, if, let's say, you know, 5 clients make up for 80% of the revenue you're making, then it's really important that you have a special focus on them. So, a page like this is great for that. And, yeah, it helps you understand that… well, it helps you to understand if you're spending the time on the clients that you should be, and make sure the distribution of work to these clients is what you expect it to be, and just make sure that you're doing what, you know, what you want the team to be doing with these clients. So I can see here really easily, I can filter, you know, see which clients we've had breaches with. See which clients contact us the most. see which clients I'm responding to the slowest, and have it in order, just so I have some kind of safety net there to know, like, if this is not what I'm expecting the team to do, then have it there in writing, so I can easily find it, and yeah, make sure that we ratify it. And then, of course, like on the previous pages, I can see that by team member, you know, see who's responsible for these clients, you know, make sure that, you know, that things are distributed fairly, and that everyone's doing the work that they should be. And then, yeah, investigate any raw data. Find any breaches. by clicking on here, then I can filter for any of these buckets at the top here. And it just makes my life easier, when it comes to… when it comes to monitoring how we're doing with, you know, with our… with our most important clients. Yeah, so those are just some examples of the kinds of things that you can do with our data. Really, it's… it's… it's… the ball is in your court when it comes to when it comes to how to use this data. Obviously, we're more than happy to give you kind of examples of what we've done with people in the past, to give you a bit of inspiration. But yeah, as I said, it's not limited to the things that I just showed you. You know, data teams are interested in various parts of communications, and so, yeah, we're really just here to give you the data and make sure that you've got it in a usable way, so that you can build out the views that you need. Yeah, so if there are any… any questions, then I would love to run through them, because that's the majority. the stuff that I wanted to run through for BigQuery.
Mélanie Lelait - Email Meter: Thanks a lot, Lawrence. I just want to take this opportunity to, remember that you can use the chat, the Q&A, and as well the raise your hand feature to ask your question. So yeah, we just have one question coming in. What does the setup of the BigQuery Direct Connector look like?
Laurence Edwards - Email Meter: Yeah, great question. So… So it's pretty, pretty straightforward. It's… yeah, I can give you a few… a kind of technical breakdown. What we can also do is I can post the link for this breakdown in the chat, so that we have it there, so you can read it afterwards if you're interested. So, I have posted it in the chat, and I will say that So first, you have to create a Google Cloud account if you don't already have one. When you have done that, you go to the Google Cloud Console, and you create a project. We've got documentation, you know, for this in order on our guide. You then create a Google Cloud billing page, and then you start, you know. Do the steps to link the billing account to the project. And then, when you've done that, you have access to your data set. So it's pretty straightforward, and yeah, if you have a data team in your company, I'm sure, yeah, all these things will be really bread and butter for them. But yeah, we've got the guide for that as well, so everything's really clear.
Mélanie Lelait - Email Meter: Nice, thank you. There's as well a second question. Why is it important to monitor how my team engage with customers?
Laurence Edwards - Email Meter: Yeah, absolutely. I mean, just in terms of making sure that your customer service is good, this is such an important part of it. You know, if customers feel like they're being ignored, then it's, you know, really damaging to the relationship you have with customers, and then it translates to, you know, to clients leaving, so I'm sure that it's something that, you know, most teams are pretty aware of. But yeah, I think that that's kind of the number one reason that people use a tool like ours, and yeah, one of the things that we're happy to be solving.
Mélanie Lelait - Email Meter: Nice, thank you. And maybe one last question? What is the benefit of using the direct connector versus a dashboard?
Laurence Edwards - Email Meter: Yeah, great question. So, both have their benefits, really, but I would say that, yeah, in terms of the direct connector, really, it just gives you the opportunity to integrate your data with any platform you're currently using. So, it's nice to have everything consolidated in one place, and if you're already using, you know, a dashboard for various other parts of your, you know, of your team, maybe for, you know, the marketing, maybe for other aspects of customer service or customer success. It just means you can have everything in one place, and you don't have to be looking at multiple reports. Yeah, this is, yeah, this is one of the benefits of using the direct connector.
Mélanie Lelait - Email Meter: Perfect. All clear. I don't know if there are any questions anymore. We will maybe let a few minutes go, and if not, we will close today's webinar.
Laurence Edwards - Email Meter: Great, yeah, we'll keep an eye out for some more questions, and if not, we can… We can hang around for a while. Perfect.
Mélanie Lelait - Email Meter: Exactly.